29
/
en
AIzaSyAYiBZKx7MnpbEhh9jyipgxe19OcubqV5w
April 1, 2024
239759
Sierra Leone
SLE
true
2
1
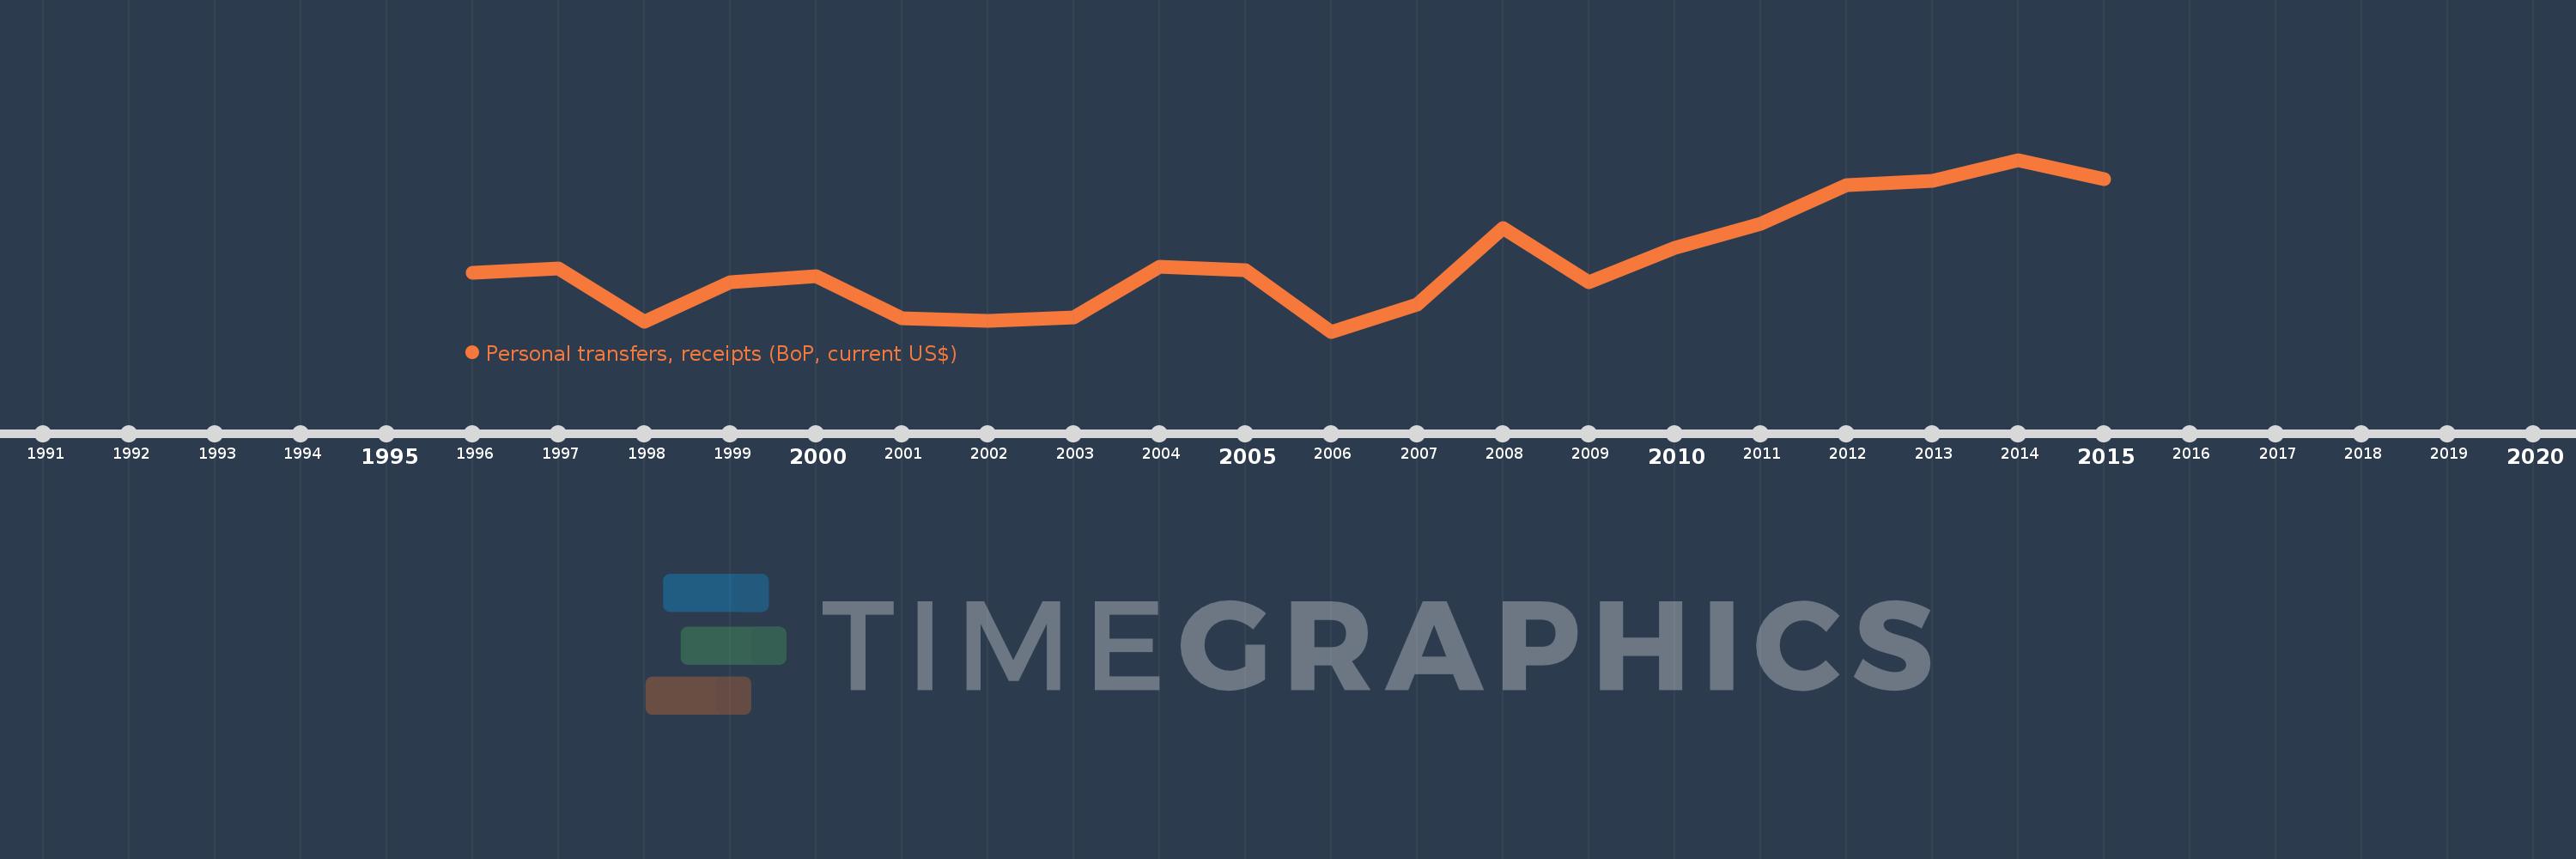
Personal transfers, receipts (BoP, current US$)
2015,2014,2013,2012,2011,2010,2009,2008,2007,2006,2005,2004,2003,2002,2001,2000,1999,1998,1997,1996
This statistics in other country:
Timeline:
This timeline shows a graph from 1996 to 2015 of Sierra Leone. No data until 1995. Number of actual observations by date: 20.
Source name:
World Development Indicators
Source organization:
International Monetary Fund, Balance of Payments Statistics Yearbook and data files.
Categories, topics:
Economy & Growth, Financial Sector
Last updated:
apr 23, 2017
Indicators value changes by year
Minimum:
2.349 mln
jan 1, 2006
Maximum:
64.761 mln
jan 1, 2014
At the date of observation
Value
Absolute change
Change from previous value
jan 1, 1996
23.674 mln
+23.674 mln
0.0%
jan 1, 1997
25.247 mln
+1.573 mln
6.64%
jan 1, 1998
5.985 mln
-19.262 mln
-76.3%
jan 1, 1999
20.331 mln
+14.346 mln
239.71%
jan 1, 2000
22.477 mln
+2.146 mln
10.56%
jan 1, 2001
7.135 mln
-15.342 mln
-68.26%
jan 1, 2002
6.215 mln
-919.716K
-12.89%
jan 1, 2003
7.454 mln
+1.239 mln
19.93%
jan 1, 2004
25.772 mln
+18.318 mln
245.75%
jan 1, 2005
24.641 mln
-1.131 mln
-4.39%
jan 1, 2006
2.349 mln
-22.292 mln
-90.47%
jan 1, 2007
12.076 mln
+9.727 mln
414.17%
jan 1, 2008
39.836 mln
+27.76 mln
229.88%
jan 1, 2009
20.228 mln
-19.607 mln
-49.22%
jan 1, 2010
32.668 mln
+12.439 mln
61.49%
jan 1, 2011
41.569 mln
+8.901 mln
27.25%
jan 1, 2012
55.51 mln
+13.942 mln
33.54%
jan 1, 2013
57.0 mln
+1.49 mln
2.68%
jan 1, 2014
64.761 mln
+7.761 mln
13.62%
jan 1, 2015
57.738 mln
-7.023 mln
-10.84%
Ranking of countries by current statistics by years


Comments: