29
/
en
AIzaSyAYiBZKx7MnpbEhh9jyipgxe19OcubqV5w
April 1, 2024
215687
Oman
OMN
true
2
1
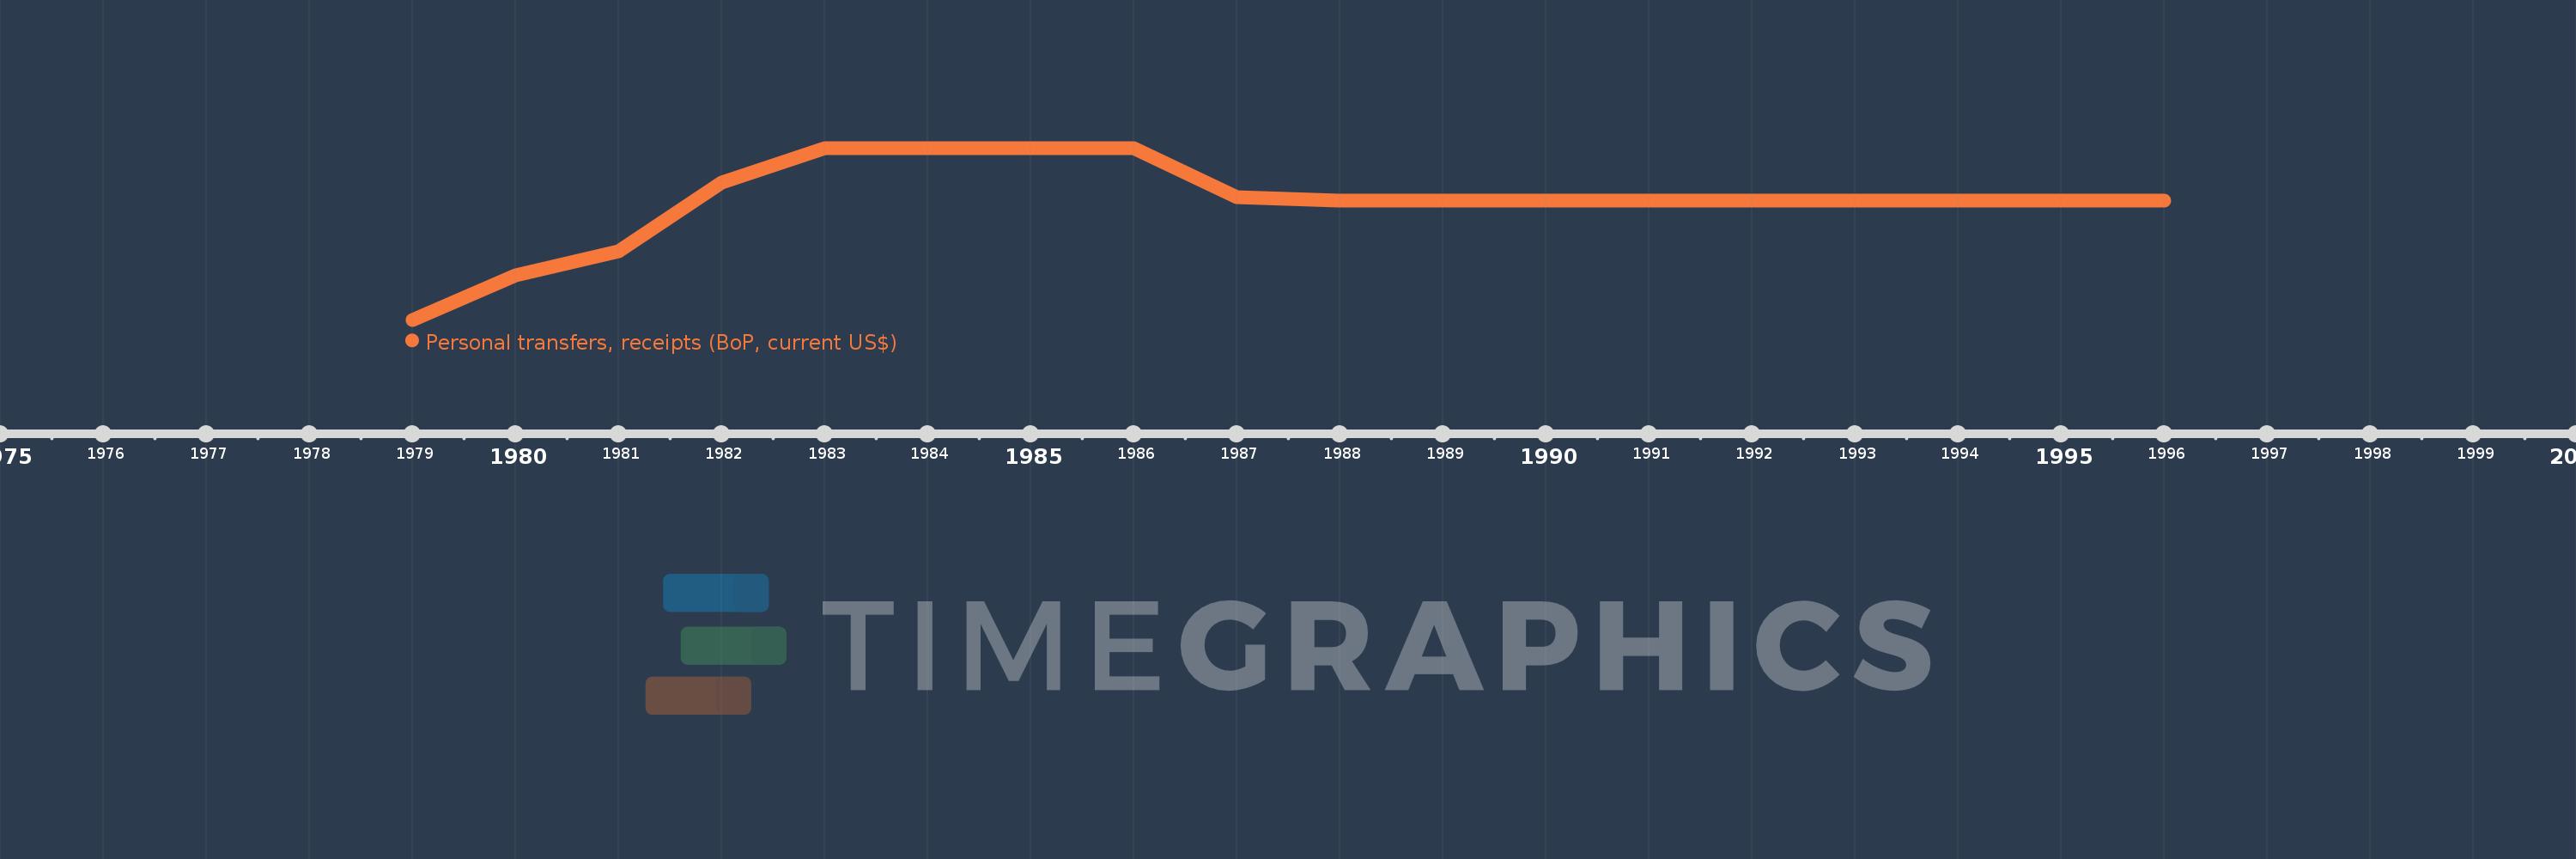
Personal transfers, receipts (BoP, current US$)
1996,1995,1994,1993,1992,1991,1990,1989,1988,1987,1986,1985,1984,1983,1982,1981,1980,1979
This statistics in other country:
Timeline:
This timeline shows a graph from 1979 to 1996 of Oman. No data until 1978. Number of actual observations by date: 18.
Source name:
World Development Indicators
Source organization:
International Monetary Fund, Balance of Payments Statistics Yearbook and data files.
Categories, topics:
Economy & Growth, Financial Sector
Last updated:
apr 23, 2017
Indicators value changes by year
Minimum:
28.952 mln
jan 1, 1979
Maximum:
43.429 mln
jan 1, 1986
At the date of observation
Value
Absolute change
Change from previous value
jan 1, 1979
28.952 mln
+28.952 mln
0.0%
jan 1, 1980
32.716 mln
+3.764 mln
13.0%
jan 1, 1981
34.742 mln
+2.027 mln
6.19%
jan 1, 1982
40.533 mln
+5.79 mln
16.67%
jan 1, 1983
43.428 mln
+2.895 mln
7.14%
jan 1, 1984
43.428 mln
0.0
0.0%
jan 1, 1985
43.428 mln
+314.259
0.0%
jan 1, 1986
43.429 mln
+314.285
0.0%
jan 1, 1987
39.269 mln
-4.16 mln
-9.58%
jan 1, 1988
39.012 mln
-257.171K
-0.65%
jan 1, 1989
39.012 mln
0.0
0.0%
jan 1, 1990
39.012 mln
0.0
0.0%
jan 1, 1991
39.012 mln
0.0
0.0%
jan 1, 1992
39.012 mln
0.0
0.0%
jan 1, 1993
39.012 mln
0.0
0.0%
jan 1, 1994
39.012 mln
+0.254
0.0%
jan 1, 1995
39.012 mln
+0.254
0.0%
jan 1, 1996
39.012 mln
+0.254
0.0%
Ranking of countries by current statistics by years


Comments: