29
/
en
AIzaSyAYiBZKx7MnpbEhh9jyipgxe19OcubqV5w
April 1, 2024
269825
Turkey
TUR
true
2
1
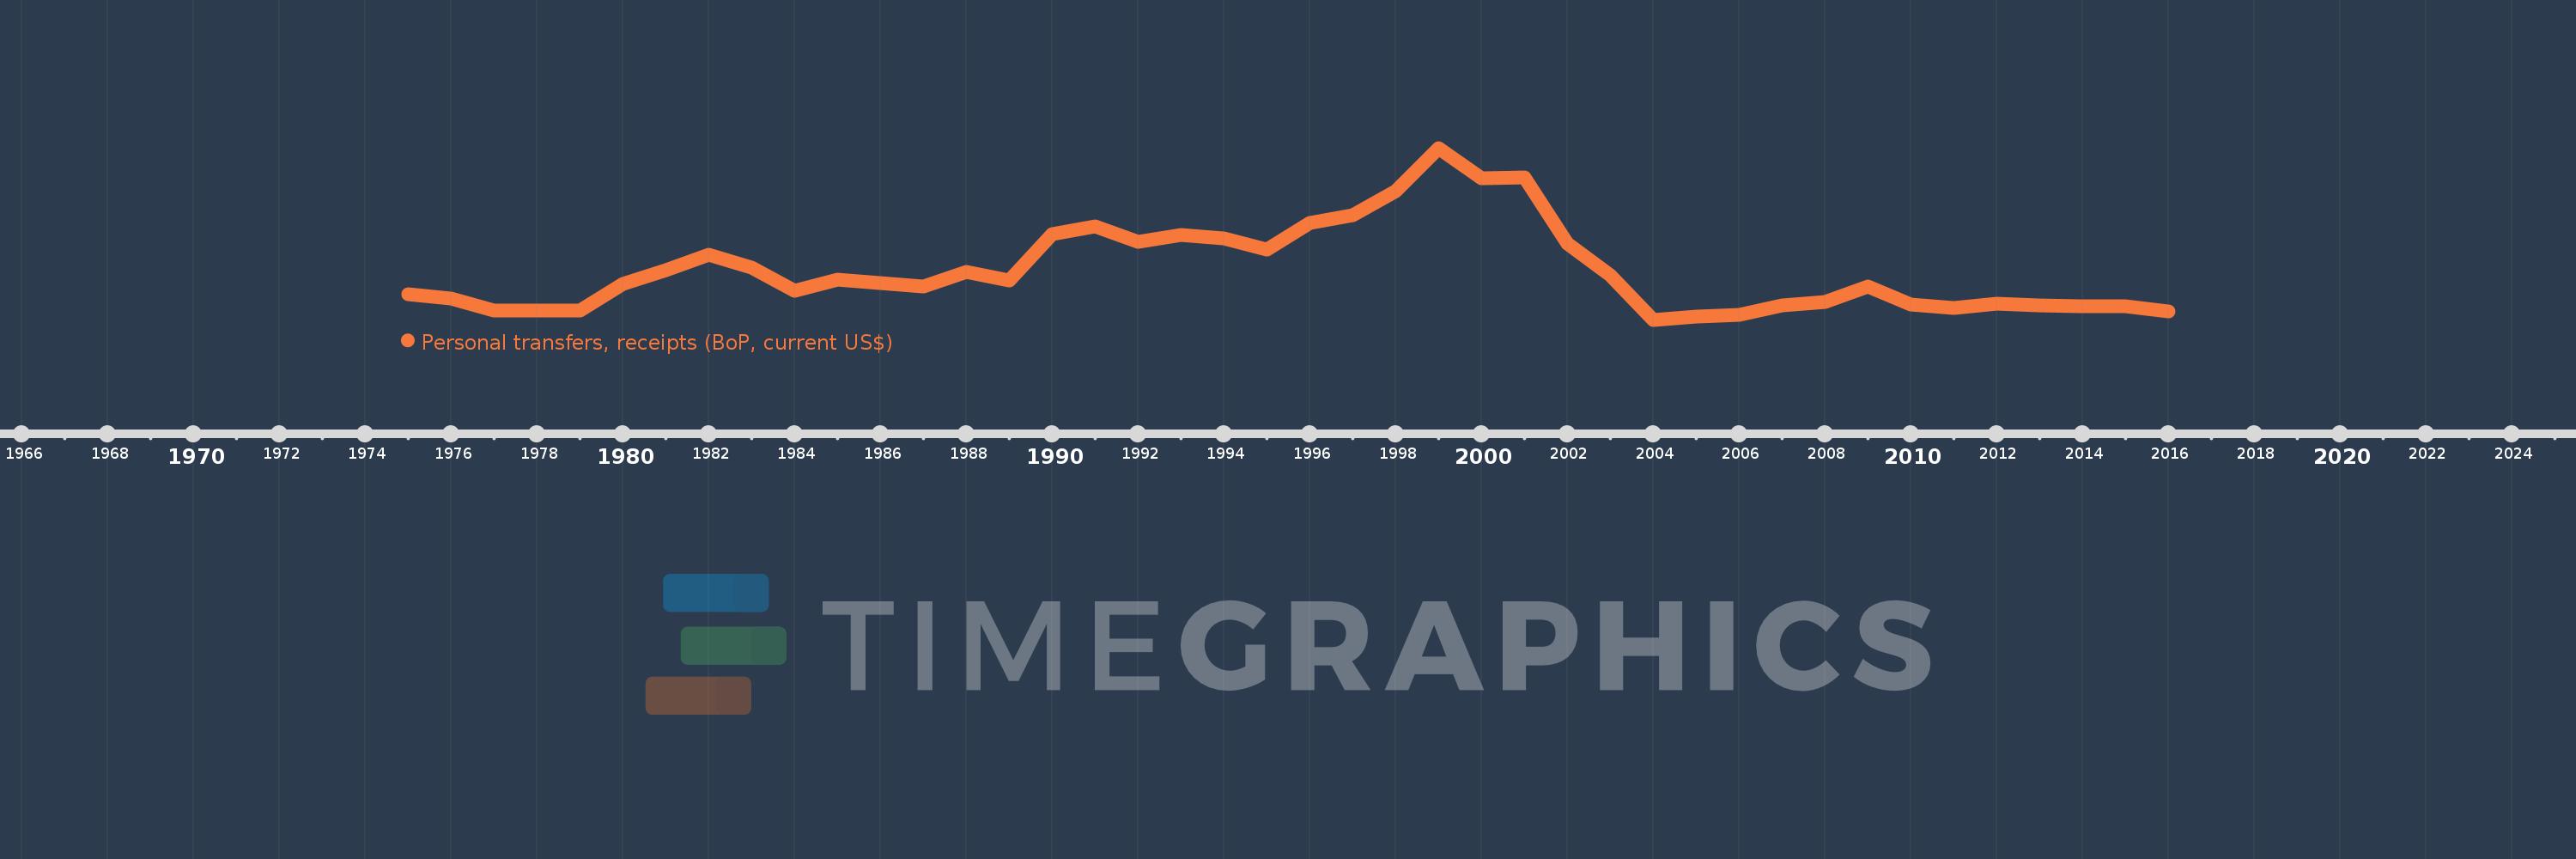
Personal transfers, receipts (BoP, current US$)
2016,2015,2014,2013,2012,2011,2010,2009,2008,2007,2006,2005,2004,2003,2002,2001,2000,1999,1998,1997,1996,1995,1994,1993,1992,1991,1990,1989,1988,1987,1986,1985,1984,1983,1982,1981,1980,1979,1978,1977,1976,1975
This statistics in other country:
Timeline:
This timeline shows a graph from 1975 to 2016 of Turkey. No data until 1974. Number of actual observations by date: 42.
Source name:
World Development Indicators
Source organization:
International Monetary Fund, Balance of Payments Statistics Yearbook and data files.
Categories, topics:
Economy & Growth, Financial Sector
Last updated:
apr 23, 2017
Indicators value changes by year
Minimum:
729.0 mln
jan 1, 2004
Maximum:
5.356 bln
jan 1, 1999
At the date of observation
Value
Absolute change
Change from previous value
jan 1, 1975
1.426 bln
+1.426 bln
0.0%
jan 1, 1976
1.312 bln
-114.0 mln
-7.99%
jan 1, 1977
982.0 mln
-330.0 mln
-25.15%
jan 1, 1978
982.0 mln
0.0
0.0%
jan 1, 1979
983.0 mln
+1000.0K
0.1%
jan 1, 1980
1.694 bln
+711.0 mln
72.33%
jan 1, 1981
2.071 bln
+377.0 mln
22.26%
jan 1, 1982
2.49 bln
+419.0 mln
20.23%
jan 1, 1983
2.14 bln
-350.0 mln
-14.06%
jan 1, 1984
1.513 bln
-627.0 mln
-29.3%
jan 1, 1985
1.807 bln
+294.0 mln
19.43%
jan 1, 1986
1.714 bln
-93.0 mln
-5.15%
jan 1, 1987
1.634 bln
-80.0 mln
-4.67%
jan 1, 1988
2.021 bln
+387.0 mln
23.68%
jan 1, 1989
1.776 bln
-245.0 mln
-12.12%
jan 1, 1990
3.04 bln
+1.264 bln
71.17%
jan 1, 1991
3.246 bln
+206.0 mln
6.78%
jan 1, 1992
2.819 bln
-427.0 mln
-13.15%
jan 1, 1993
3.008 bln
+189.0 mln
6.7%
jan 1, 1994
2.919 bln
-89.0 mln
-2.96%
jan 1, 1995
2.627 bln
-292.0 mln
-10.0%
jan 1, 1996
3.327 bln
+700.0 mln
26.65%
jan 1, 1997
3.542 bln
+215.0 mln
6.46%
jan 1, 1998
4.197 bln
+655.0 mln
18.49%
jan 1, 1999
5.356 bln
+1.159 bln
27.61%
jan 1, 2000
4.533 bln
-823.0 mln
-15.37%
jan 1, 2001
4.56 bln
+27.0 mln
0.6%
jan 1, 2002
2.786 bln
-1.774 bln
-38.9%
jan 1, 2003
1.936 bln
-850.0 mln
-30.51%
jan 1, 2004
729.0 mln
-1.207 bln
-62.35%
jan 1, 2005
804.0 mln
+75.0 mln
10.29%
jan 1, 2006
851.0 mln
+47.0 mln
5.85%
jan 1, 2007
1.111 bln
+260.0 mln
30.55%
jan 1, 2008
1.209 bln
+98.0 mln
8.82%
jan 1, 2009
1.613 bln
+404.0 mln
33.42%
jan 1, 2010
1.129 bln
-484.0 mln
-30.01%
jan 1, 2011
1.055 bln
-74.0 mln
-6.55%
jan 1, 2012
1.168 bln
+113.0 mln
10.71%
jan 1, 2013
1.113 bln
-55.0 mln
-4.71%
jan 1, 2014
1.094 bln
-19.0 mln
-1.71%
jan 1, 2015
1.092 bln
-2.0 mln
-0.18%
jan 1, 2016
952.0 mln
-140.0 mln
-12.82%
Ranking of countries by current statistics by years


Comments: