29
/
en
AIzaSyAYiBZKx7MnpbEhh9jyipgxe19OcubqV5w
April 1, 2024
55070
Post-demographic dividend
PST
false
2
1
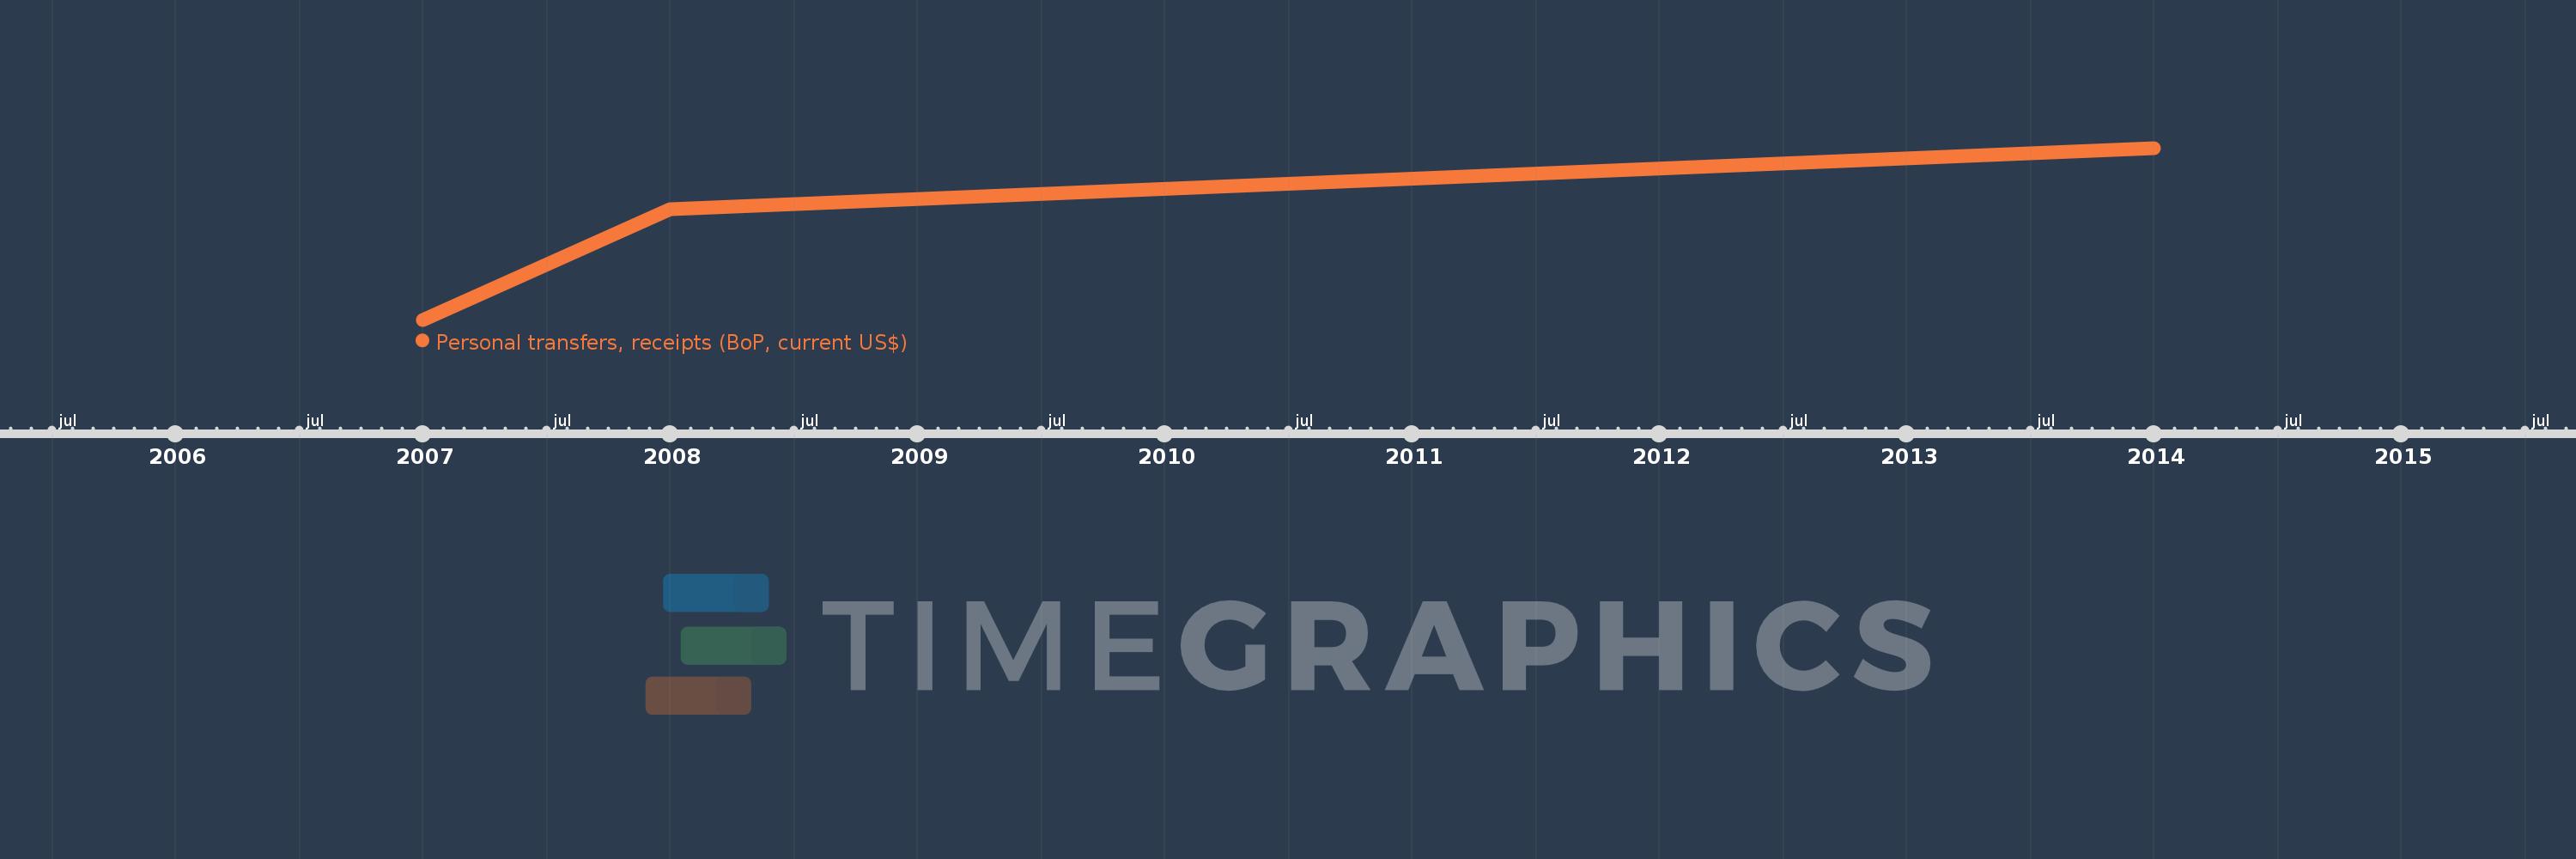
Personal transfers, receipts (BoP, current US$)
2014,2008,2007
This statistics in other country:
Timeline:
This timeline shows a graph from 2007 to 2014 of Post-demographic dividend. No data until 2006. Number of actual observations by date: 3.
Source name:
World Development Indicators
Source organization:
International Monetary Fund, Balance of Payments Statistics Yearbook and data files.
Categories, topics:
Economy & Growth, Financial Sector
Last updated:
apr 23, 2017
Indicators value changes by year
Minimum:
20.995 bln
jan 1, 2007
Maximum:
27.079 bln
jan 1, 2014
At the date of observation
Value
Absolute change
Change from previous value
jan 1, 2007
20.995 bln
+20.995 bln
0.0%
jan 1, 2008
24.924 bln
+3.93 bln
18.72%
jan 1, 2014
27.079 bln
+2.154 bln
8.64%
Ranking of countries by current statistics by years


Comments: