29
/
en
AIzaSyAYiBZKx7MnpbEhh9jyipgxe19OcubqV5w
April 1, 2024
37688
IDA & IBRD total
IBT
false
2
1
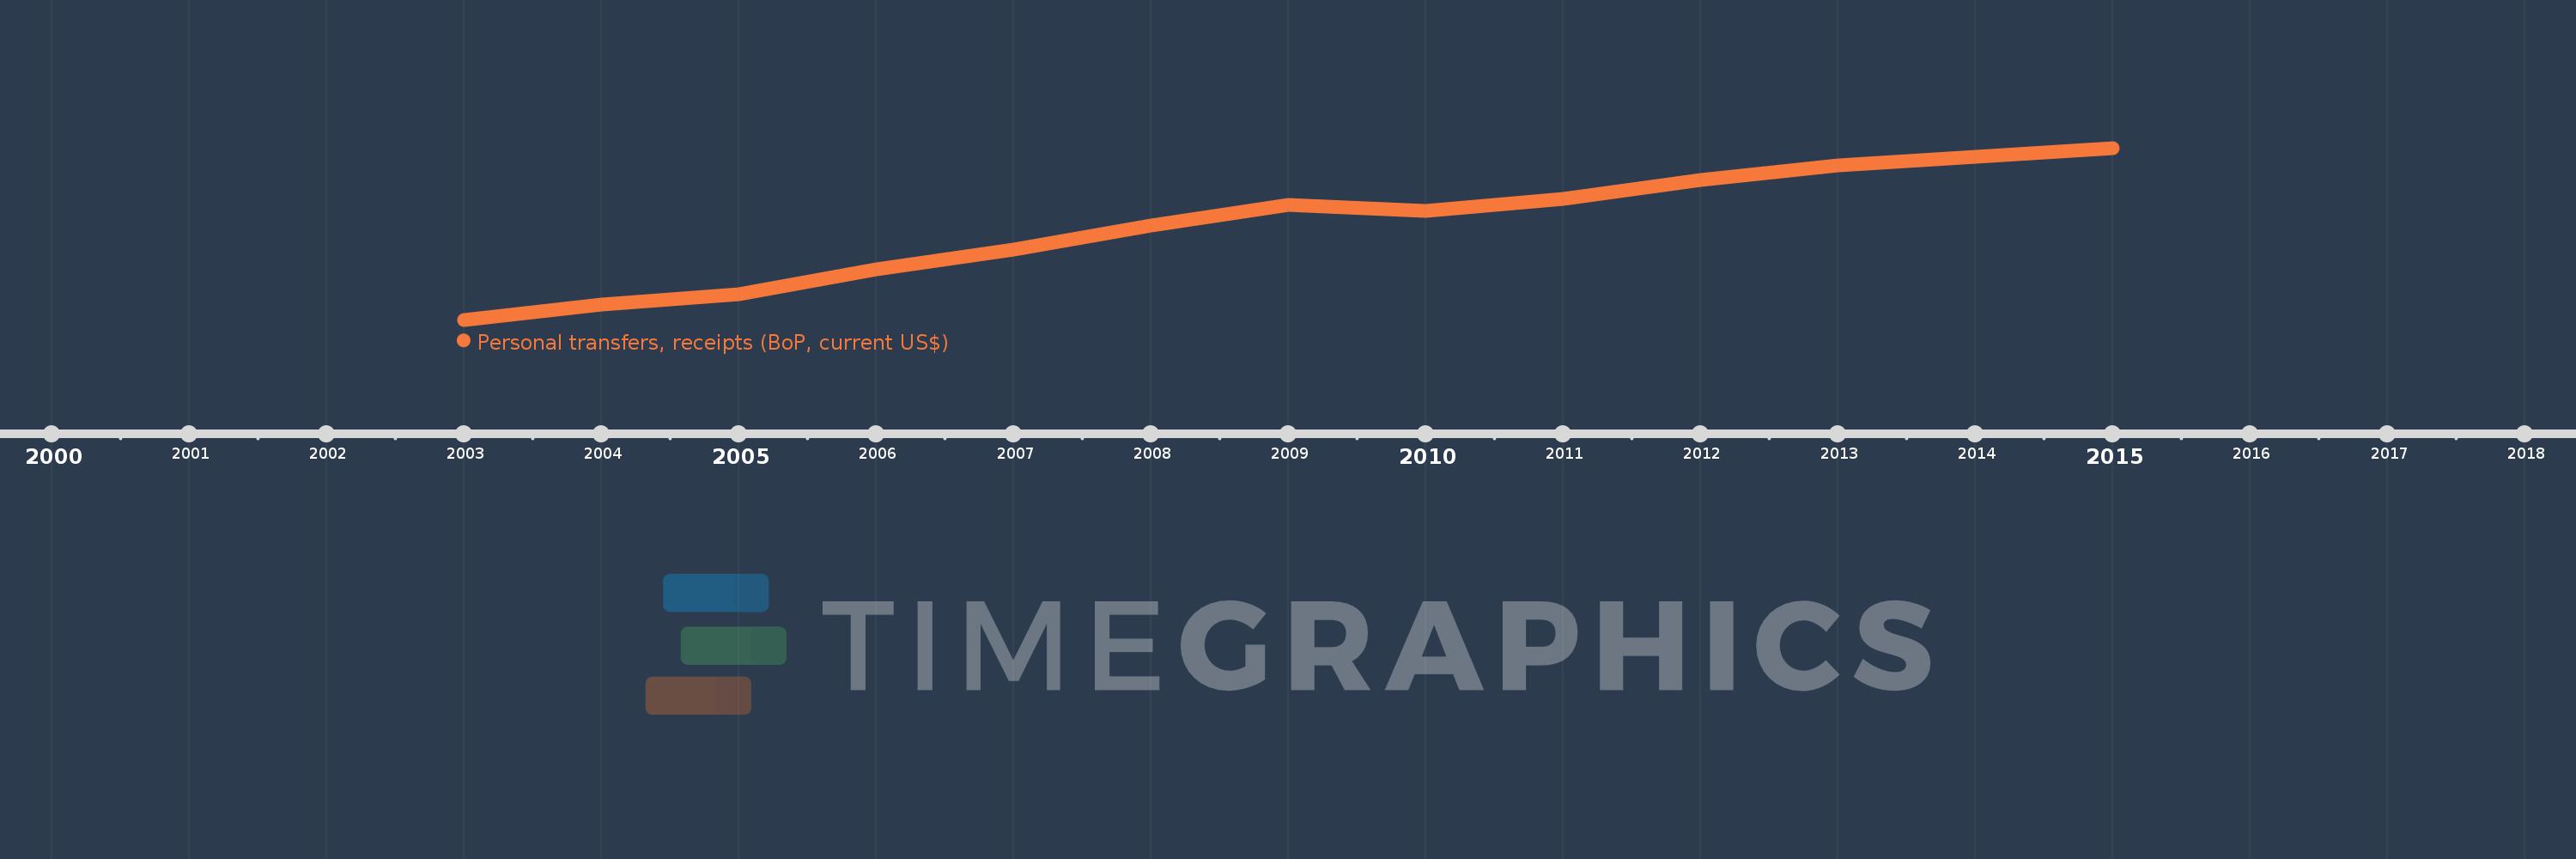
Personal transfers, receipts (BoP, current US$)
2015,2014,2013,2012,2011,2010,2009,2008,2007,2006,2005,2004,2003
This statistics in other country:
Timeline:
This timeline shows a graph from 2003 to 2015 of IDA & IBRD total. No data until 2002. Number of actual observations by date: 13.
Source name:
World Development Indicators
Source organization:
International Monetary Fund, Balance of Payments Statistics Yearbook and data files.
Categories, topics:
Economy & Growth, Financial Sector
Last updated:
apr 23, 2017
Indicators value changes by year
Minimum:
81.458 bln
jan 1, 2003
Maximum:
318.828 bln
jan 1, 2015
At the date of observation
Value
Absolute change
Change from previous value
jan 1, 2003
81.458 bln
+81.458 bln
0.0%
jan 1, 2004
101.993 bln
+20.535 bln
25.21%
jan 1, 2005
116.118 bln
+14.125 bln
13.85%
jan 1, 2006
150.734 bln
+34.616 bln
29.81%
jan 1, 2007
178.566 bln
+27.832 bln
18.46%
jan 1, 2008
211.335 bln
+32.77 bln
18.35%
jan 1, 2009
239.887 bln
+28.552 bln
13.51%
jan 1, 2010
231.45 bln
-8.436 bln
-3.52%
jan 1, 2011
248.875 bln
+17.424 bln
7.53%
jan 1, 2012
275.035 bln
+26.16 bln
10.51%
jan 1, 2013
294.21 bln
+19.175 bln
6.97%
jan 1, 2014
306.971 bln
+12.762 bln
4.34%
jan 1, 2015
318.828 bln
+11.857 bln
3.86%
Ranking of countries by current statistics by years


Comments: