29
/
en
AIzaSyAYiBZKx7MnpbEhh9jyipgxe19OcubqV5w
April 1, 2024
281459
Venezuela, RB
VEN
true
2
1
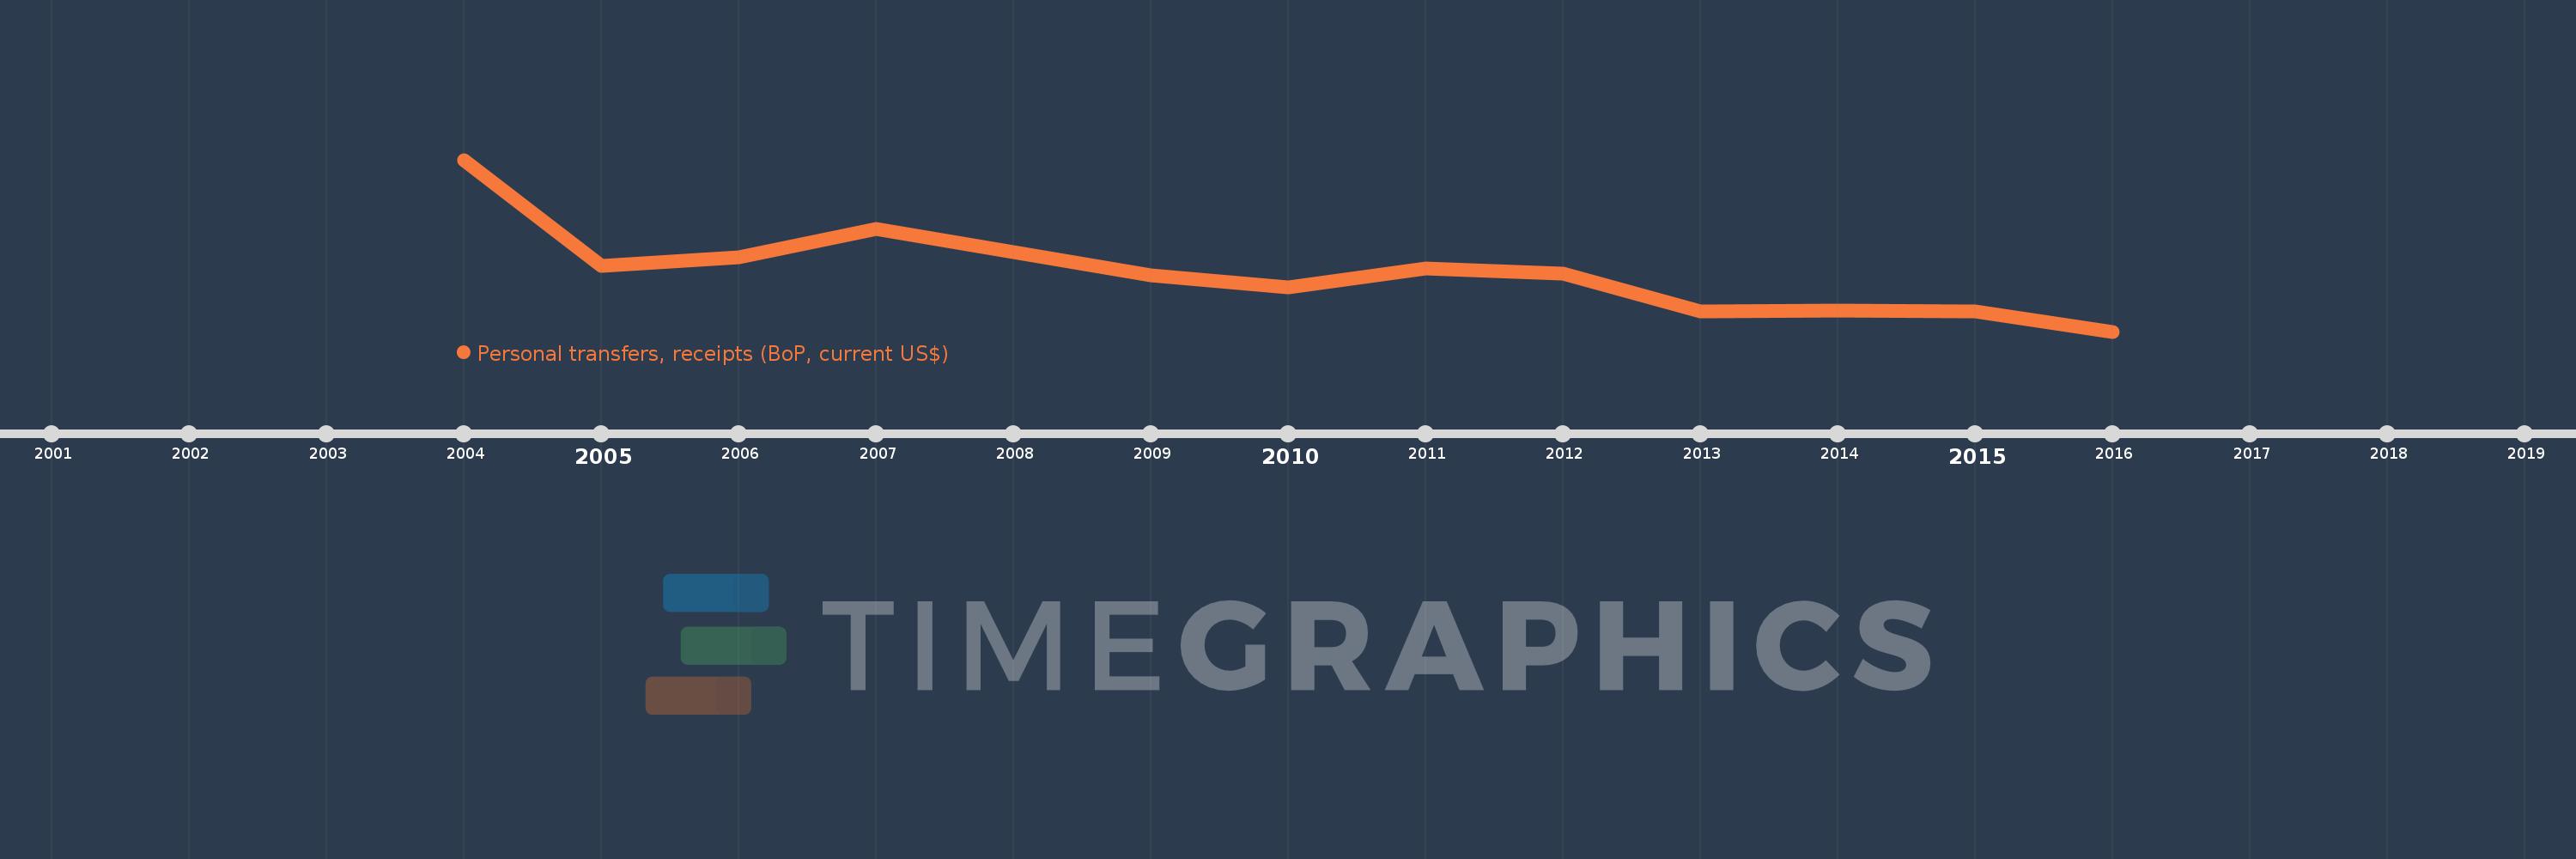
Personal transfers, receipts (BoP, current US$)
2016,2015,2014,2013,2012,2011,2010,2009,2008,2007,2006,2005,2004
This statistics in other country:
Timeline:
This timeline shows a graph from 2004 to 2016 of Venezuela, RB. No data until 2003. Number of actual observations by date: 13.
Source name:
World Development Indicators
Source organization:
International Monetary Fund, Balance of Payments Statistics Yearbook and data files.
Categories, topics:
Economy & Growth, Financial Sector
Last updated:
apr 23, 2017
Indicators value changes by year
Minimum:
83.0 mln
jan 1, 2016
Maximum:
187.0 mln
jan 1, 2004
At the date of observation
Value
Absolute change
Change from previous value
jan 1, 2004
187.0 mln
+187.0 mln
0.0%
jan 1, 2005
123.0 mln
-64.0 mln
-34.22%
jan 1, 2006
128.0 mln
+5.0 mln
4.07%
jan 1, 2007
145.0 mln
+17.0 mln
13.28%
jan 1, 2008
131.0 mln
-14.0 mln
-9.66%
jan 1, 2009
117.0 mln
-14.0 mln
-10.69%
jan 1, 2010
110.0 mln
-7.0 mln
-5.98%
jan 1, 2011
121.0 mln
+11.0 mln
10.0%
jan 1, 2012
118.0 mln
-3.0 mln
-2.48%
jan 1, 2013
95.0 mln
-23.0 mln
-19.49%
jan 1, 2014
96.0 mln
+1000.0K
1.05%
jan 1, 2015
95.0 mln
-1000.0K
-1.04%
jan 1, 2016
83.0 mln
-12.0 mln
-12.63%
Ranking of countries by current statistics by years


Comments: