29
/
en
AIzaSyAYiBZKx7MnpbEhh9jyipgxe19OcubqV5w
April 1, 2024
267274
Trinidad and Tobago
TTO
true
2
1
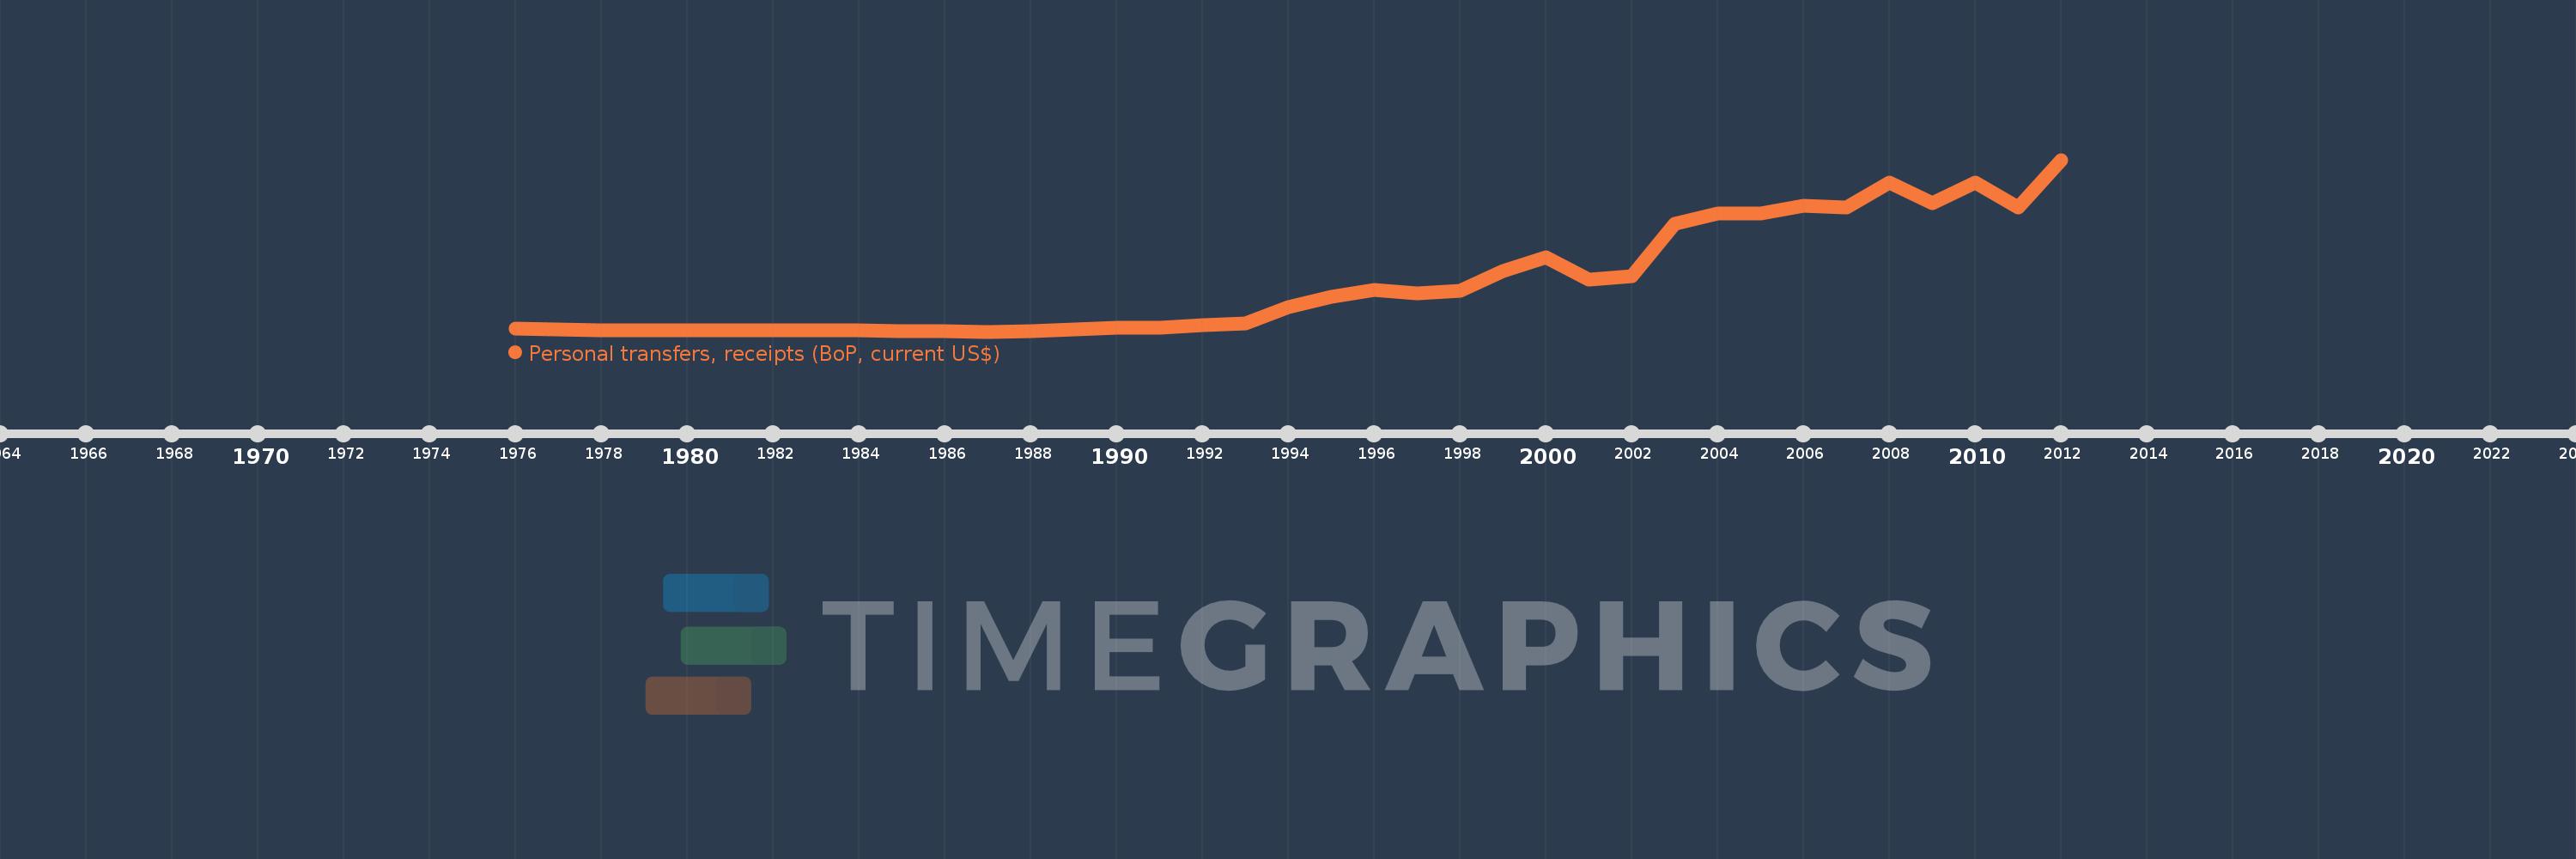
Personal transfers, receipts (BoP, current US$)
2012,2011,2010,2009,2008,2007,2006,2005,2004,2003,2002,2001,2000,1999,1998,1997,1996,1995,1994,1993,1992,1991,1990,1989,1988,1987,1986,1985,1984,1983,1982,1981,1980,1979,1978,1977,1976
This statistics in other country:
Timeline:
This timeline shows a graph from 1976 to 2012 of Trinidad and Tobago. No data until 1975. Number of actual observations by date: 37.
Source name:
World Development Indicators
Source organization:
International Monetary Fund, Balance of Payments Statistics Yearbook and data files.
Categories, topics:
Economy & Growth, Financial Sector
Last updated:
apr 23, 2017
Indicators value changes by year
Minimum:
166.667K
jan 1, 1987
Maximum:
126.068 mln
jan 1, 2012
At the date of observation
Value
Absolute change
Change from previous value
jan 1, 1976
2.627 mln
+2.627 mln
0.0%
jan 1, 1977
1.642 mln
-984.793K
-37.49%
jan 1, 1978
1.417 mln
-225.513K
-13.73%
jan 1, 1979
1.417 mln
0.0
0.0%
jan 1, 1980
1.417 mln
0.0
0.0%
jan 1, 1981
1.417 mln
0.0
0.0%
jan 1, 1982
1.417 mln
0.0
0.0%
jan 1, 1983
1.375 mln
-41.667K
-2.94%
jan 1, 1984
1.375 mln
0.0
0.0%
jan 1, 1985
250.0K
-1.125 mln
-81.82%
jan 1, 1986
204.082K
-45.918K
-18.37%
jan 1, 1987
166.667K
-37.415K
-18.33%
jan 1, 1988
277.778K
+111.111K
66.67%
jan 1, 1989
1.717 mln
+1.439 mln
518.15%
jan 1, 1990
2.871 mln
+1.154 mln
67.18%
jan 1, 1991
2.988 mln
+117.647K
4.1%
jan 1, 1992
4.8 mln
+1.812 mln
60.63%
jan 1, 1993
6.188 mln
+1.388 mln
28.92%
jan 1, 1994
18.258 mln
+12.07 mln
195.04%
jan 1, 1995
25.671 mln
+7.413 mln
40.6%
jan 1, 1996
30.398 mln
+4.727 mln
18.41%
jan 1, 1997
28.126 mln
-2.272 mln
-7.47%
jan 1, 1998
30.2 mln
+2.074 mln
7.37%
jan 1, 1999
44.568 mln
+14.368 mln
47.58%
jan 1, 2000
54.4 mln
+9.832 mln
22.06%
jan 1, 2001
38.1 mln
-16.3 mln
-29.96%
jan 1, 2002
40.9 mln
+2.8 mln
7.35%
jan 1, 2003
79.1 mln
+38.2 mln
93.4%
jan 1, 2004
86.8 mln
+7.7 mln
9.73%
jan 1, 2005
86.9 mln
+100.0K
0.12%
jan 1, 2006
92.4 mln
+5.5 mln
6.33%
jan 1, 2007
91.2 mln
-1.2 mln
-1.3%
jan 1, 2008
109.4 mln
+18.2 mln
19.96%
jan 1, 2009
94.5 mln
-14.9 mln
-13.62%
jan 1, 2010
109.3 mln
+14.8 mln
15.66%
jan 1, 2011
90.9 mln
-18.4 mln
-16.83%
jan 1, 2012
126.068 mln
+35.168 mln
38.69%
Ranking of countries by current statistics by years


Comments: