29
/
en
AIzaSyAYiBZKx7MnpbEhh9jyipgxe19OcubqV5w
April 1, 2024
257683
Switzerland
CHE
true
2
1
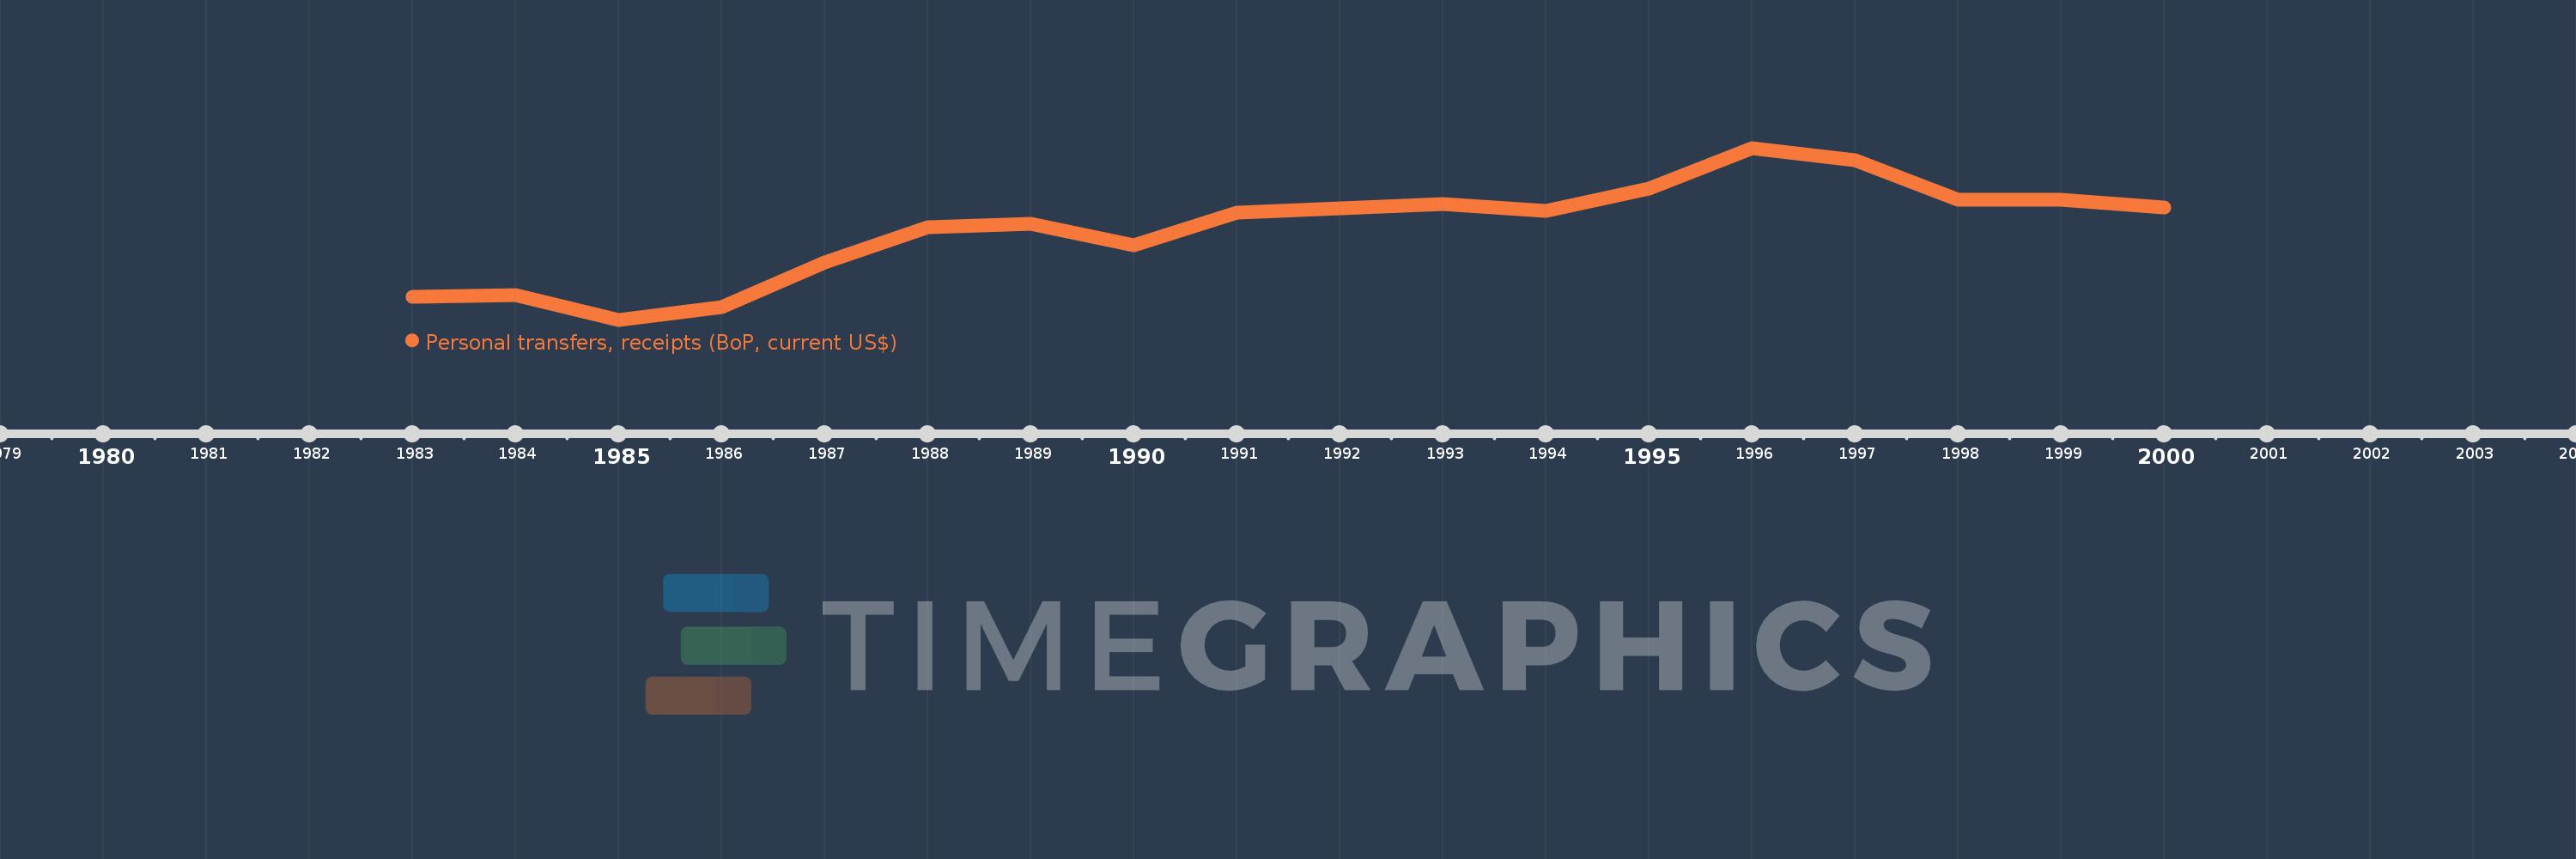
Personal transfers, receipts (BoP, current US$)
2000,1999,1998,1997,1996,1995,1994,1993,1992,1991,1990,1989,1988,1987,1986,1985,1984,1983
This statistics in other country:
Timeline:
This timeline shows a graph from 1983 to 2000 of Switzerland. No data until 1982. Number of actual observations by date: 18.
Source name:
World Development Indicators
Source organization:
International Monetary Fund, Balance of Payments Statistics Yearbook and data files.
Categories, topics:
Economy & Growth, Financial Sector
Last updated:
apr 23, 2017
Indicators value changes by year
Minimum:
69.371 mln
jan 1, 1985
Maximum:
177.594 mln
jan 1, 1996
At the date of observation
Value
Absolute change
Change from previous value
jan 1, 1983
83.732 mln
+83.732 mln
0.0%
jan 1, 1984
84.797 mln
+1.064 mln
1.27%
jan 1, 1985
69.371 mln
-15.426 mln
-18.19%
jan 1, 1986
77.326 mln
+7.955 mln
11.47%
jan 1, 1987
105.619 mln
+28.293 mln
36.59%
jan 1, 1988
127.415 mln
+21.796 mln
20.64%
jan 1, 1989
129.844 mln
+2.429 mln
1.91%
jan 1, 1990
116.142 mln
-13.701 mln
-10.55%
jan 1, 1991
136.773 mln
+20.631 mln
17.76%
jan 1, 1992
139.471 mln
+2.697 mln
1.97%
jan 1, 1993
142.225 mln
+2.755 mln
1.98%
jan 1, 1994
138.06 mln
-4.165 mln
-2.93%
jan 1, 1995
152.081 mln
+14.021 mln
10.16%
jan 1, 1996
177.594 mln
+25.514 mln
16.78%
jan 1, 1997
169.902 mln
-7.693 mln
-4.33%
jan 1, 1998
144.697 mln
-25.205 mln
-14.84%
jan 1, 1999
144.984 mln
+287.574K
0.2%
jan 1, 2000
140.198 mln
-4.786 mln
-3.3%
Ranking of countries by current statistics by years


Comments: