29
/
en
AIzaSyAYiBZKx7MnpbEhh9jyipgxe19OcubqV5w
April 1, 2024
163042
Jamaica
JAM
true
2
1
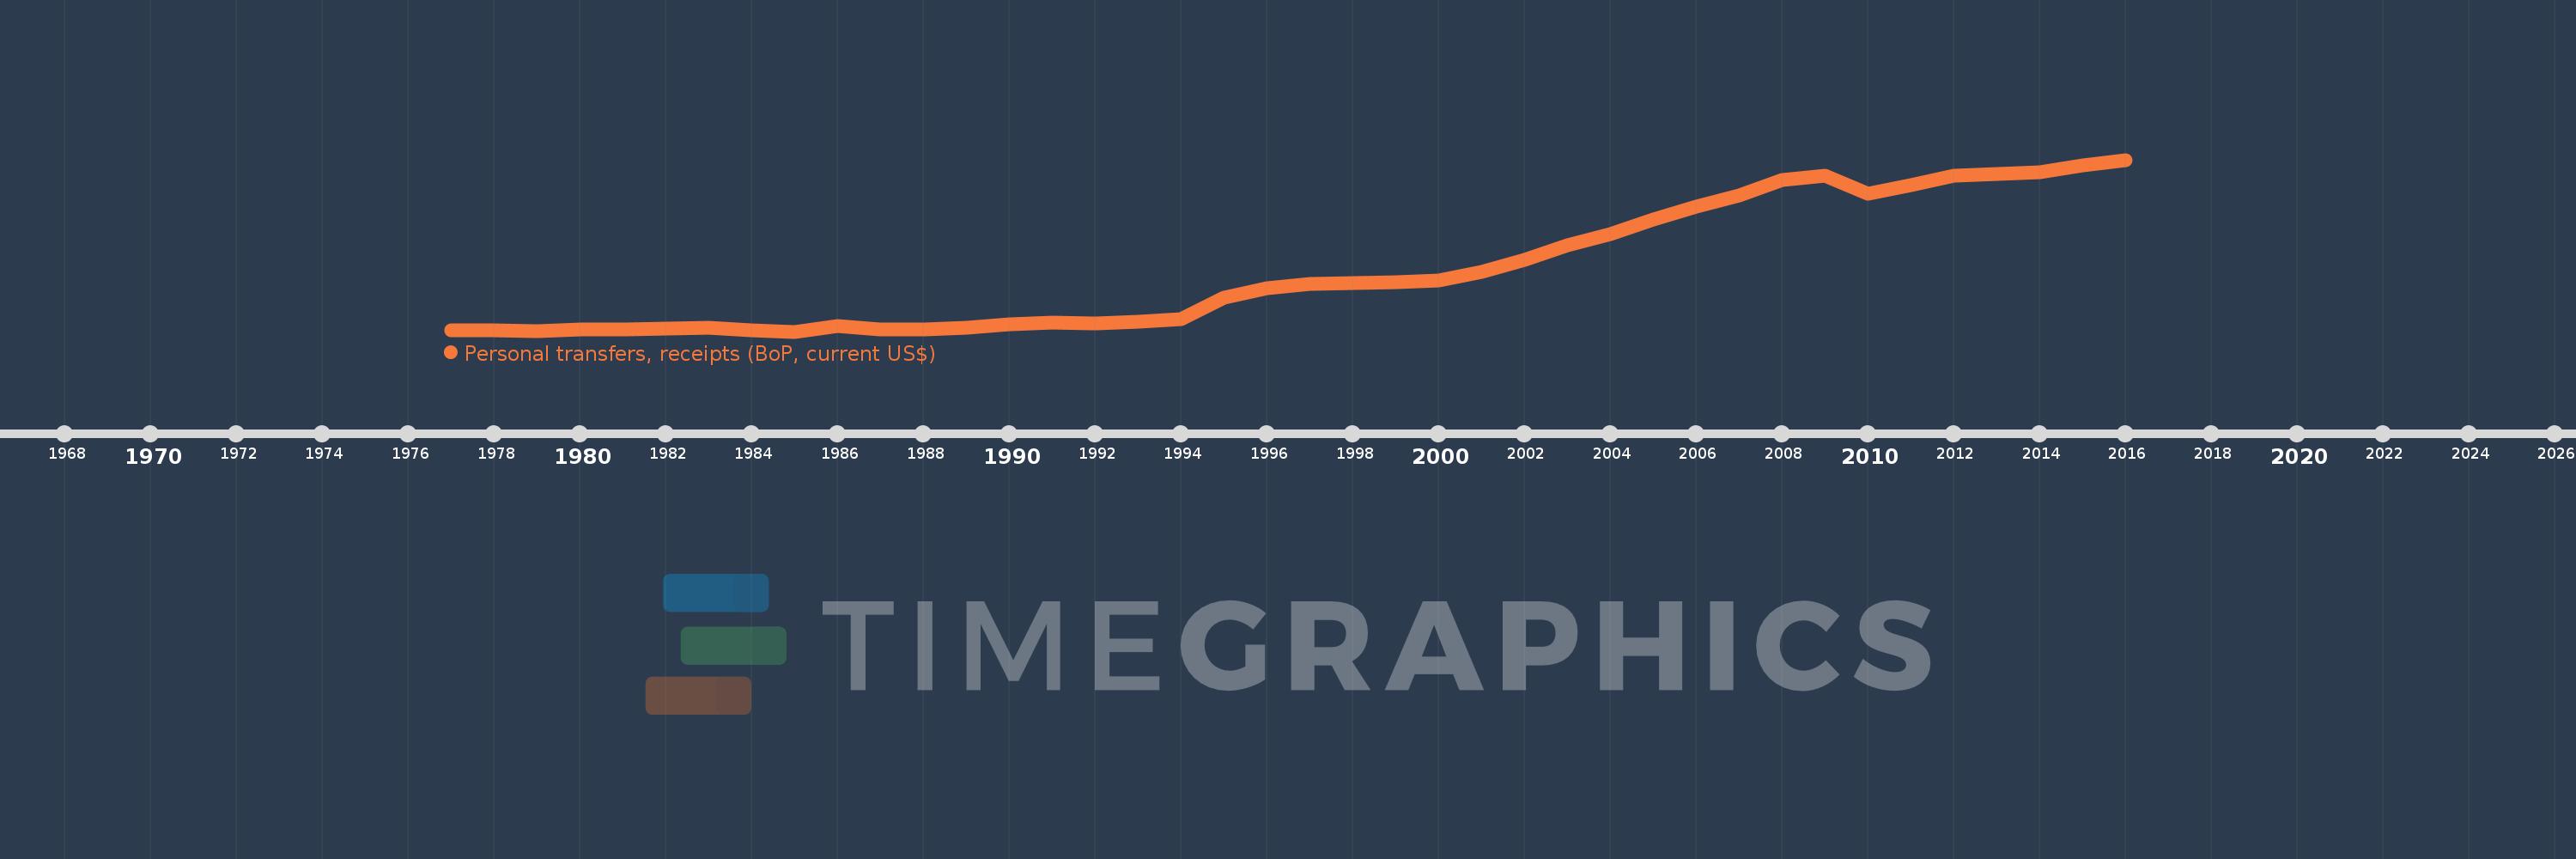
Personal transfers, receipts (BoP, current US$)
2016,2015,2014,2013,2012,2011,2010,2009,2008,2007,2006,2005,2004,2003,2002,2001,2000,1999,1998,1997,1996,1995,1994,1993,1992,1991,1990,1989,1988,1987,1986,1985,1984,1983,1982,1981,1980,1979,1978,1977
This statistics in other country:
Timeline:
This timeline shows a graph from 1977 to 2016 of Jamaica. No data until 1976. Number of actual observations by date: 40.
Source name:
World Development Indicators
Source organization:
International Monetary Fund, Balance of Payments Statistics Yearbook and data files.
Categories, topics:
Economy & Growth, Financial Sector
Last updated:
apr 23, 2017
Indicators value changes by year
Minimum:
26.1 mln
jan 1, 1985
Maximum:
2.226 bln
jan 1, 2016
At the date of observation
Value
Absolute change
Change from previous value
jan 1, 1977
47.5 mln
+47.5 mln
0.0%
jan 1, 1978
41.0 mln
-6.5 mln
-13.68%
jan 1, 1979
26.5 mln
-14.5 mln
-35.37%
jan 1, 1980
48.7 mln
+22.2 mln
83.77%
jan 1, 1981
50.6 mln
+1.9 mln
3.9%
jan 1, 1982
62.7 mln
+12.1 mln
23.91%
jan 1, 1983
74.5 mln
+11.8 mln
18.82%
jan 1, 1984
41.6 mln
-32.9 mln
-44.16%
jan 1, 1985
26.1 mln
-15.5 mln
-37.26%
jan 1, 1986
92.3 mln
+66.2 mln
253.64%
jan 1, 1987
54.0 mln
-38.3 mln
-41.5%
jan 1, 1988
54.7 mln
+700.0K
1.3%
jan 1, 1989
76.0 mln
+21.3 mln
38.94%
jan 1, 1990
116.2 mln
+40.2 mln
52.89%
jan 1, 1991
136.2 mln
+20.0 mln
17.21%
jan 1, 1992
135.6 mln
-600.0K
-0.44%
jan 1, 1993
157.7 mln
+22.1 mln
16.3%
jan 1, 1994
187.2 mln
+29.5 mln
18.71%
jan 1, 1995
457.9 mln
+270.7 mln
144.6%
jan 1, 1996
582.3 mln
+124.4 mln
27.17%
jan 1, 1997
635.5 mln
+53.2 mln
9.14%
jan 1, 1998
642.3 mln
+6.8 mln
1.07%
jan 1, 1999
654.7 mln
+12.4 mln
1.93%
jan 1, 2000
681.0 mln
+26.3 mln
4.02%
jan 1, 2001
789.5 mln
+108.5 mln
15.93%
jan 1, 2002
939.9 mln
+150.4 mln
19.05%
jan 1, 2003
1.131 bln
+190.7 mln
20.29%
jan 1, 2004
1.27 bln
+138.9 mln
12.29%
jan 1, 2005
1.466 bln
+196.296 mln
15.46%
jan 1, 2006
1.621 bln
+155.428 mln
10.6%
jan 1, 2007
1.769 bln
+148.165 mln
9.14%
jan 1, 2008
1.964 bln
+194.93 mln
11.02%
jan 1, 2009
2.021 bln
+57.172 mln
2.91%
jan 1, 2010
1.79 bln
-231.182 mln
-11.44%
jan 1, 2011
1.906 bln
+115.874 mln
6.47%
jan 1, 2012
2.025 bln
+118.876 mln
6.24%
jan 1, 2013
2.042 bln
+17.409 mln
0.86%
jan 1, 2014
2.065 bln
+22.47 mln
1.1%
jan 1, 2015
2.157 bln
+92.101 mln
4.46%
jan 1, 2016
2.226 bln
+68.977 mln
3.2%
Ranking of countries by current statistics by years


Comments: