29
/
en
AIzaSyAYiBZKx7MnpbEhh9jyipgxe19OcubqV5w
April 1, 2024
207234
Nepal
NPL
true
2
1
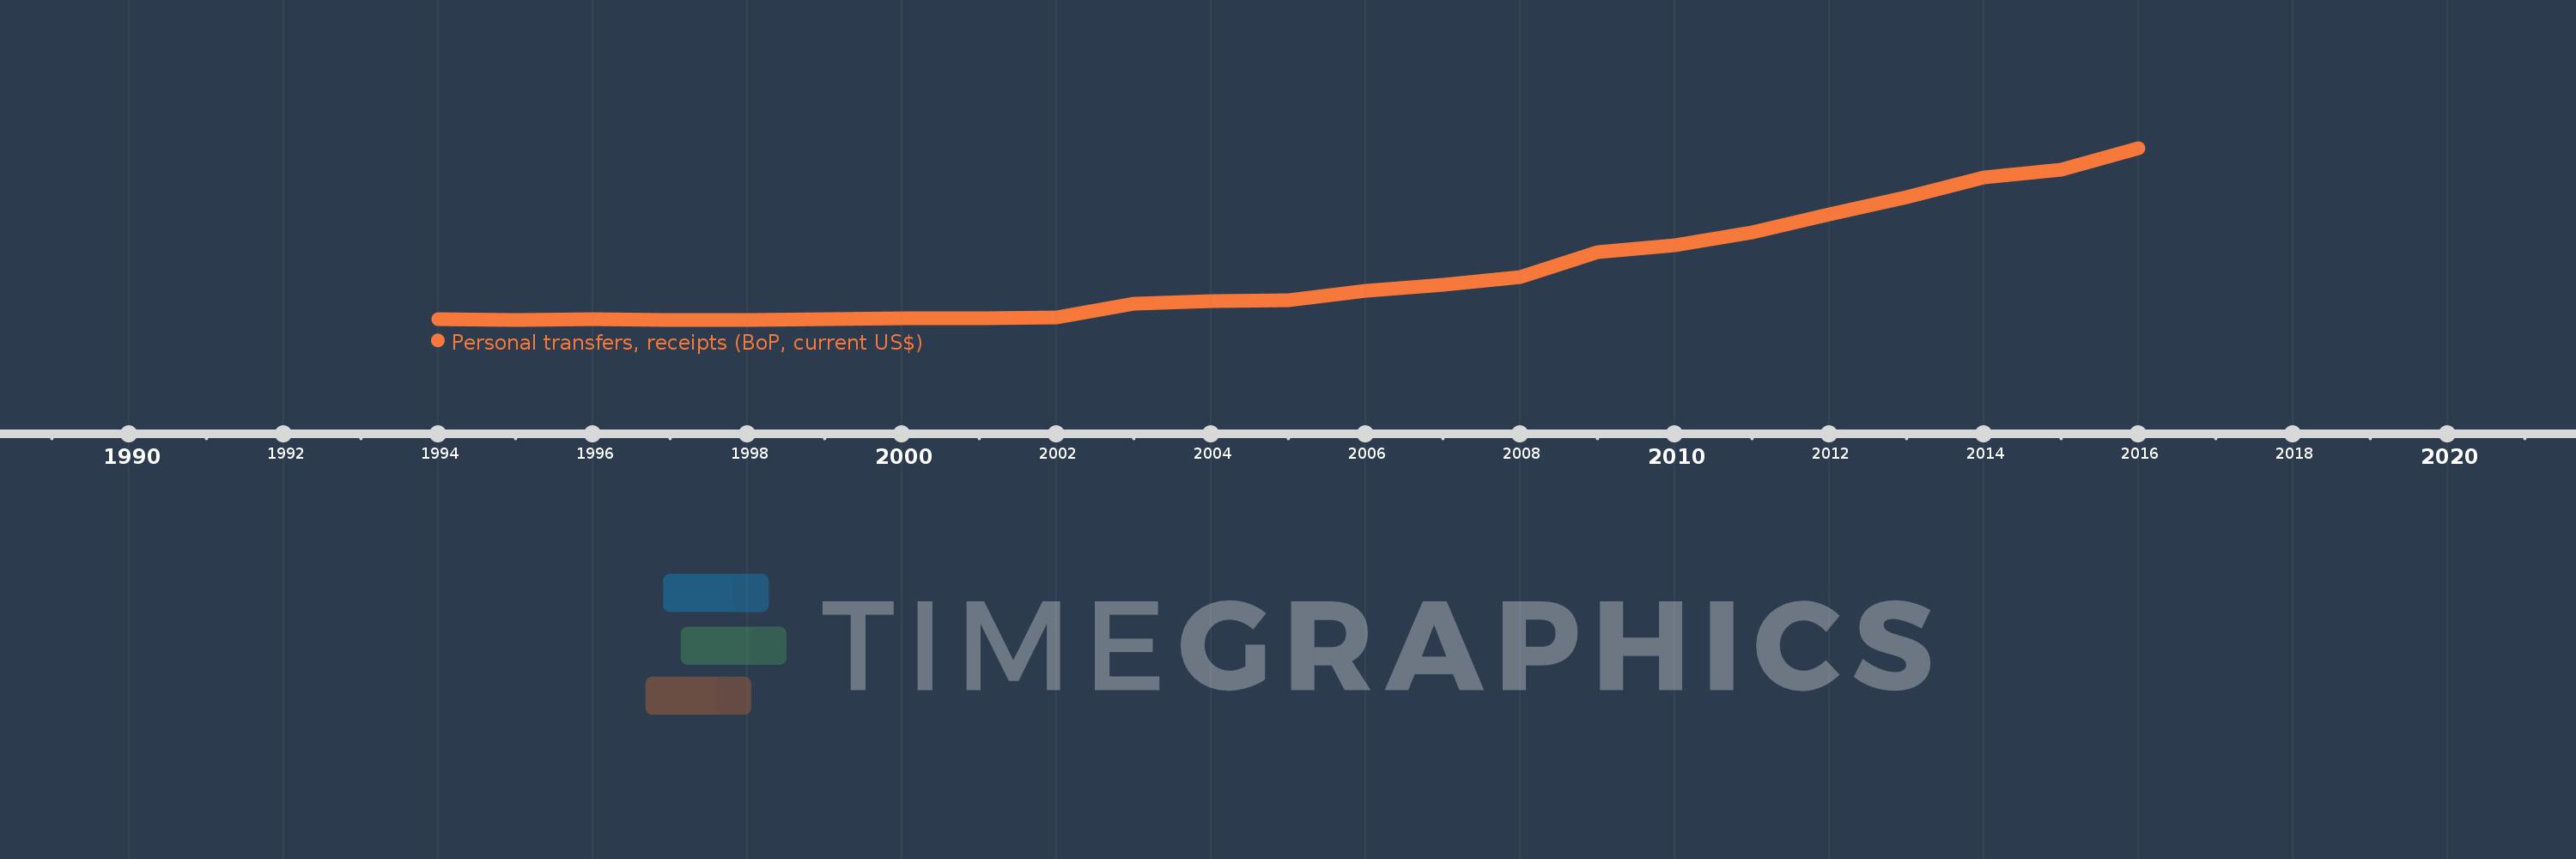
Personal transfers, receipts (BoP, current US$)
2016,2015,2014,2013,2012,2011,2010,2009,2008,2007,2006,2005,2004,2003,2002,2001,2000,1999,1998,1997,1996,1995,1994
This statistics in other country:
Timeline:
This timeline shows a graph from 1994 to 2016 of Nepal. No data until 1993. Number of actual observations by date: 23.
Source name:
World Development Indicators
Source organization:
International Monetary Fund, Balance of Payments Statistics Yearbook and data files.
Categories, topics:
Economy & Growth, Financial Sector
Last updated:
apr 23, 2017
Indicators value changes by year
Minimum:
44.16 mln
jan 1, 1997
Maximum:
6.498 bln
jan 1, 2016
At the date of observation
Value
Absolute change
Change from previous value
jan 1, 1994
54.825 mln
+54.825 mln
0.0%
jan 1, 1995
50.119 mln
-4.707 mln
-8.58%
jan 1, 1996
56.823 mln
+6.704 mln
13.38%
jan 1, 1997
44.16 mln
-12.663 mln
-22.28%
jan 1, 1998
49.458 mln
+5.298 mln
12.0%
jan 1, 1999
67.505 mln
+18.047 mln
36.49%
jan 1, 2000
83.463 mln
+15.958 mln
23.64%
jan 1, 2001
111.498 mln
+28.035 mln
33.59%
jan 1, 2002
146.985 mln
+35.487 mln
31.83%
jan 1, 2003
655.029 mln
+508.044 mln
345.64%
jan 1, 2004
744.396 mln
+89.366 mln
13.64%
jan 1, 2005
792.59 mln
+48.194 mln
6.47%
jan 1, 2006
1.126 bln
+333.754 mln
42.11%
jan 1, 2007
1.373 bln
+246.946 mln
21.92%
jan 1, 2008
1.647 bln
+273.856 mln
19.94%
jan 1, 2009
2.581 bln
+934.148 mln
56.71%
jan 1, 2010
2.856 bln
+274.864 mln
10.65%
jan 1, 2011
3.332 bln
+475.651 mln
16.65%
jan 1, 2012
4.01 bln
+678.652 mln
20.37%
jan 1, 2013
4.633 bln
+623.027 mln
15.54%
jan 1, 2014
5.403 bln
+770.008 mln
16.62%
jan 1, 2015
5.678 bln
+274.255 mln
5.08%
jan 1, 2016
6.498 bln
+820.471 mln
14.45%
Ranking of countries by current statistics by years


Comments: