29
/
en
AIzaSyAYiBZKx7MnpbEhh9jyipgxe19OcubqV5w
April 1, 2024
62933
World
WLD
false
2
1
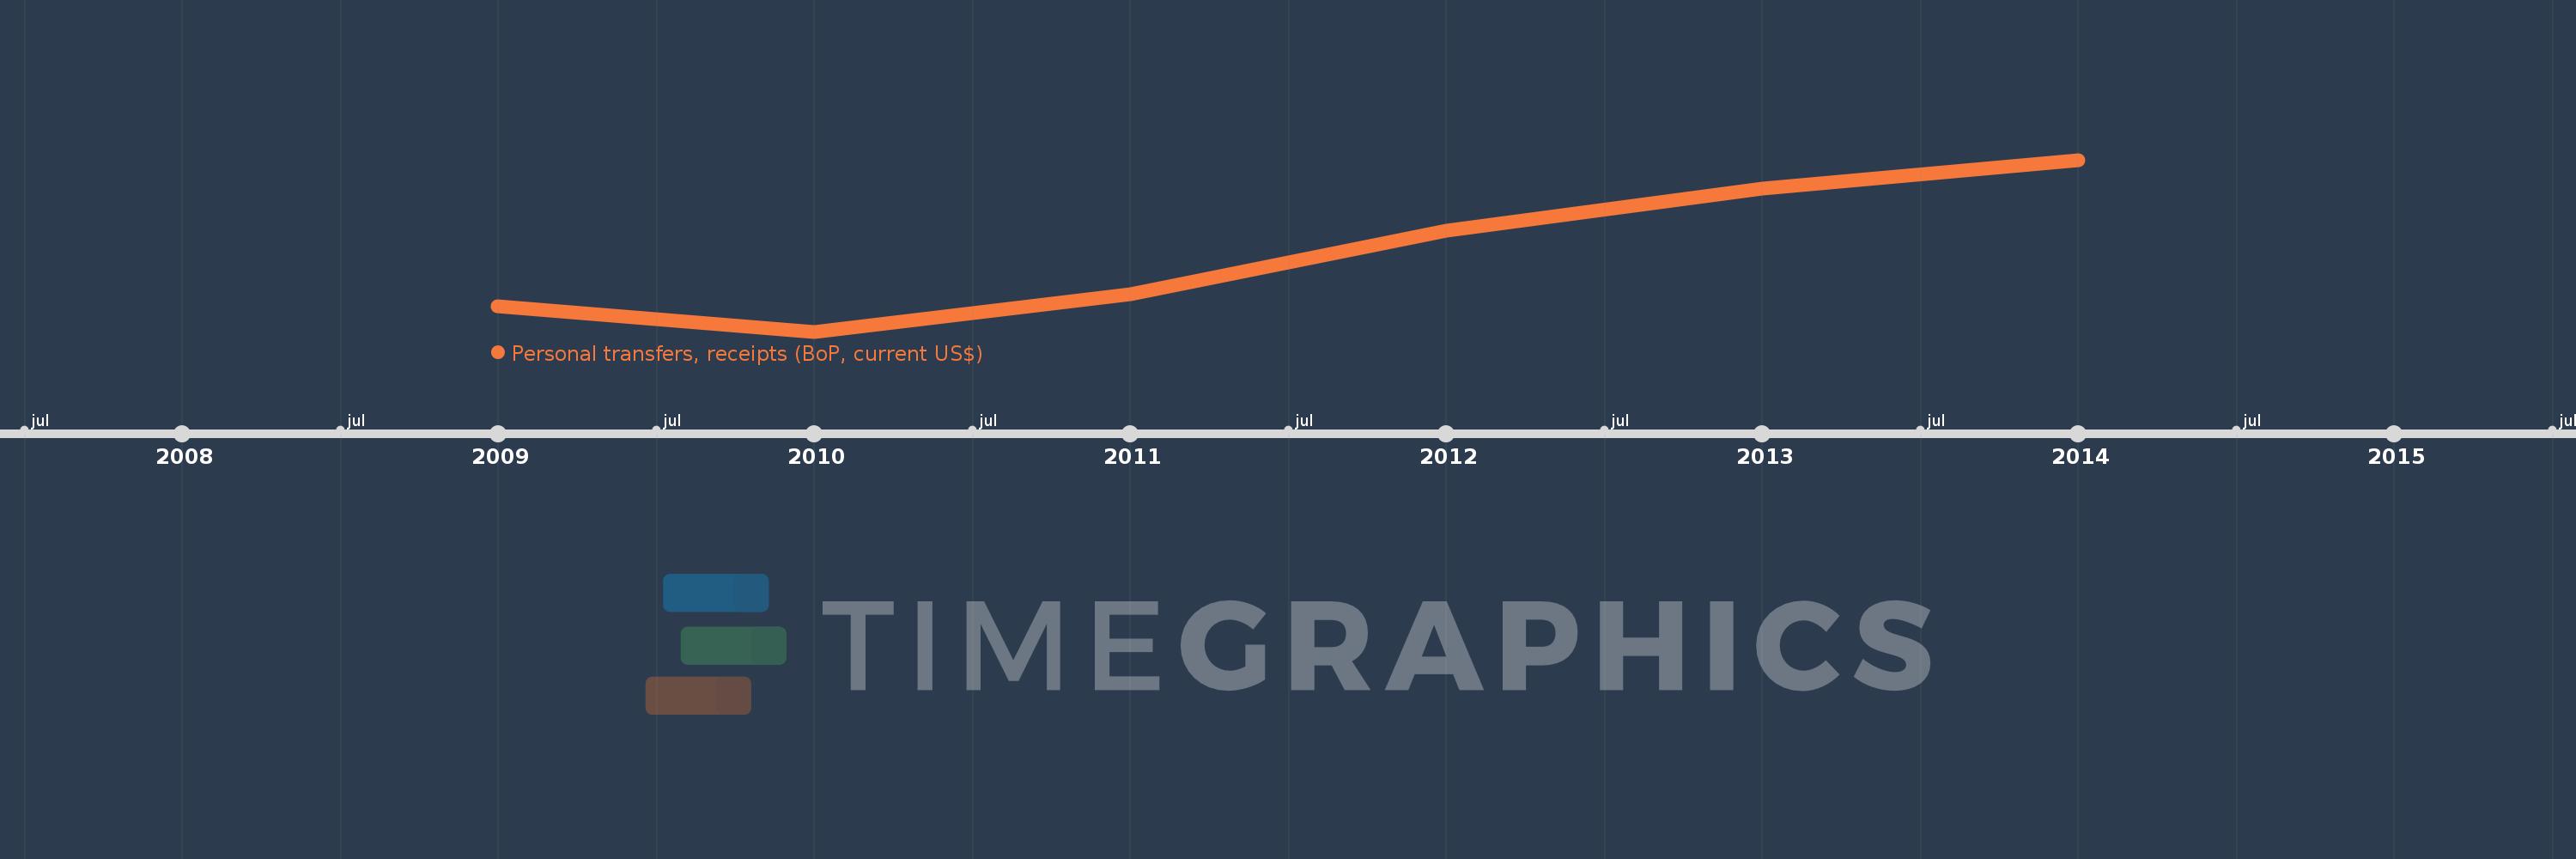
Personal transfers, receipts (BoP, current US$)
2014,2013,2012,2011,2010,2009
This statistics in other country:
Timeline:
This timeline shows a graph from 2009 to 2014 of World. No data until 2008. Number of actual observations by date: 6.
Source name:
World Development Indicators
Source organization:
International Monetary Fund, Balance of Payments Statistics Yearbook and data files.
Categories, topics:
Economy & Growth, Financial Sector
Last updated:
apr 23, 2017
Indicators value changes by year
Minimum:
251.801 bln
jan 1, 2010
Maximum:
329.189 bln
jan 1, 2014
At the date of observation
Value
Absolute change
Change from previous value
jan 1, 2009
263.385 bln
+263.385 bln
0.0%
jan 1, 2010
251.801 bln
-11.583 bln
-4.4%
jan 1, 2011
268.61 bln
+16.809 bln
6.68%
jan 1, 2012
297.21 bln
+28.6 bln
10.65%
jan 1, 2013
316.201 bln
+18.991 bln
6.39%
jan 1, 2014
329.189 bln
+12.988 bln
4.11%
Ranking of countries by current statistics by years


Comments: