29
/
en
AIzaSyAYiBZKx7MnpbEhh9jyipgxe19OcubqV5w
April 1, 2024
135963
Gabon
GAB
true
2
1
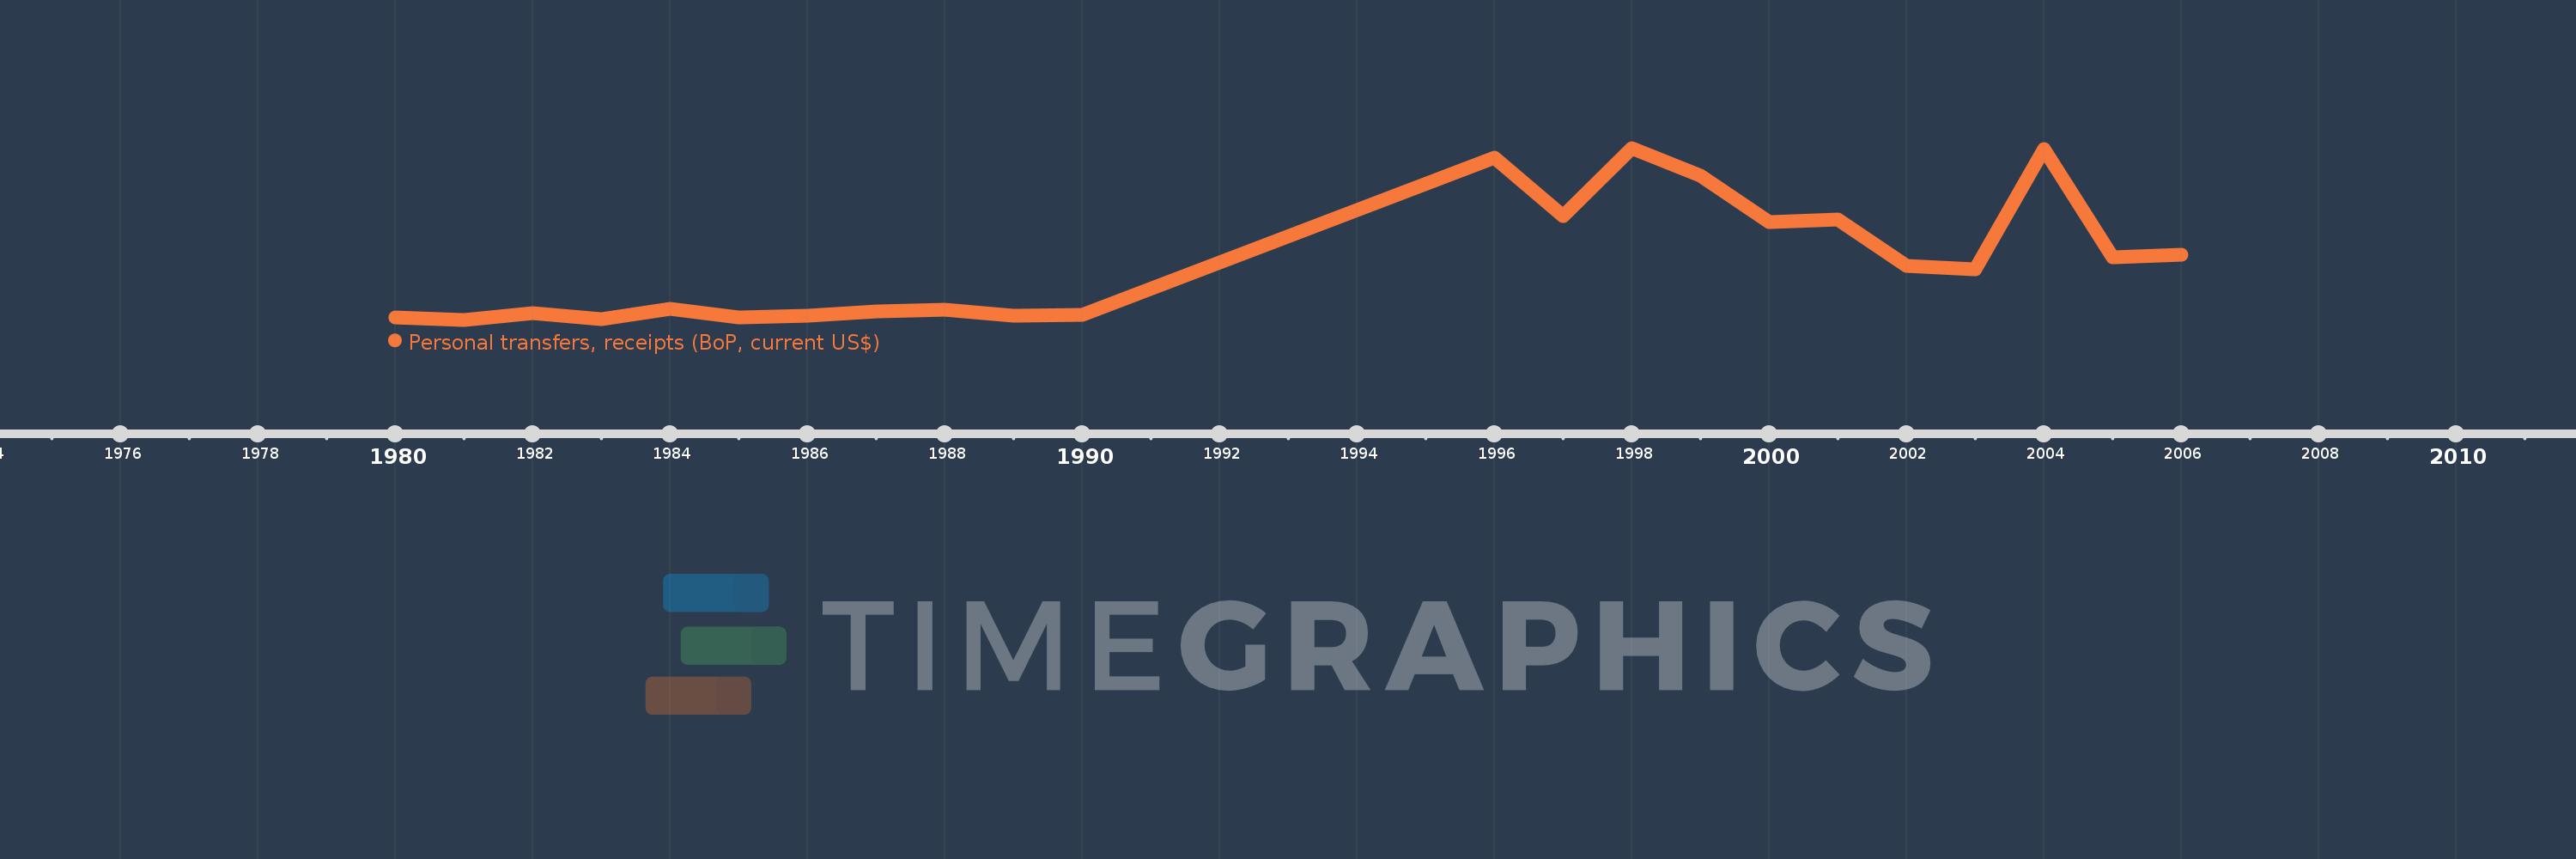
Personal transfers, receipts (BoP, current US$)
2006,2005,2004,2003,2002,2001,2000,1999,1998,1997,1996,1990,1989,1988,1987,1986,1985,1984,1983,1982,1981,1980
This statistics in other country:
Timeline:
This timeline shows a graph from 1980 to 2006 of Gabon. No data until 1979. Number of actual observations by date: 22.
Source name:
World Development Indicators
Source organization:
International Monetary Fund, Balance of Payments Statistics Yearbook and data files.
Categories, topics:
Economy & Growth, Financial Sector
Last updated:
apr 23, 2017
Indicators value changes by year
Minimum:
47.331K
jan 1, 1981
Maximum:
3.838 mln
jan 1, 1998
At the date of observation
Value
Absolute change
Change from previous value
jan 1, 1980
94.02K
+94.02K
0.0%
jan 1, 1981
47.331K
-46.689K
-49.66%
jan 1, 1982
184.005K
+136.675K
288.77%
jan 1, 1983
60.863K
-123.142K
-66.92%
jan 1, 1984
288.664K
+227.801K
374.28%
jan 1, 1985
91.542K
-197.122K
-68.29%
jan 1, 1986
133.552K
+42.01K
45.89%
jan 1, 1987
231.01K
+97.458K
72.97%
jan 1, 1988
266.191K
+35.181K
15.23%
jan 1, 1989
134.297K
-131.894K
-49.55%
jan 1, 1990
156.736K
+22.439K
16.71%
jan 1, 1996
3.622 mln
+3.465 mln
2.21K%
jan 1, 1997
2.34 mln
-1.282 mln
-35.4%
jan 1, 1998
3.838 mln
+1.498 mln
64.01%
jan 1, 1999
3.231 mln
-607.017K
-15.82%
jan 1, 2000
2.196 mln
-1.035 mln
-32.03%
jan 1, 2001
2.259 mln
+62.625K
2.85%
jan 1, 2002
1.239 mln
-1.02 mln
-45.15%
jan 1, 2003
1.156 mln
-82.276K
-6.64%
jan 1, 2004
3.806 mln
+2.65 mln
229.12%
jan 1, 2005
1.431 mln
-2.375 mln
-62.4%
jan 1, 2006
1.479 mln
+47.716K
3.33%
Ranking of countries by current statistics by years


Comments: