29
/
en
AIzaSyAYiBZKx7MnpbEhh9jyipgxe19OcubqV5w
April 1, 2024
238637
Seychelles
SYC
true
2
1
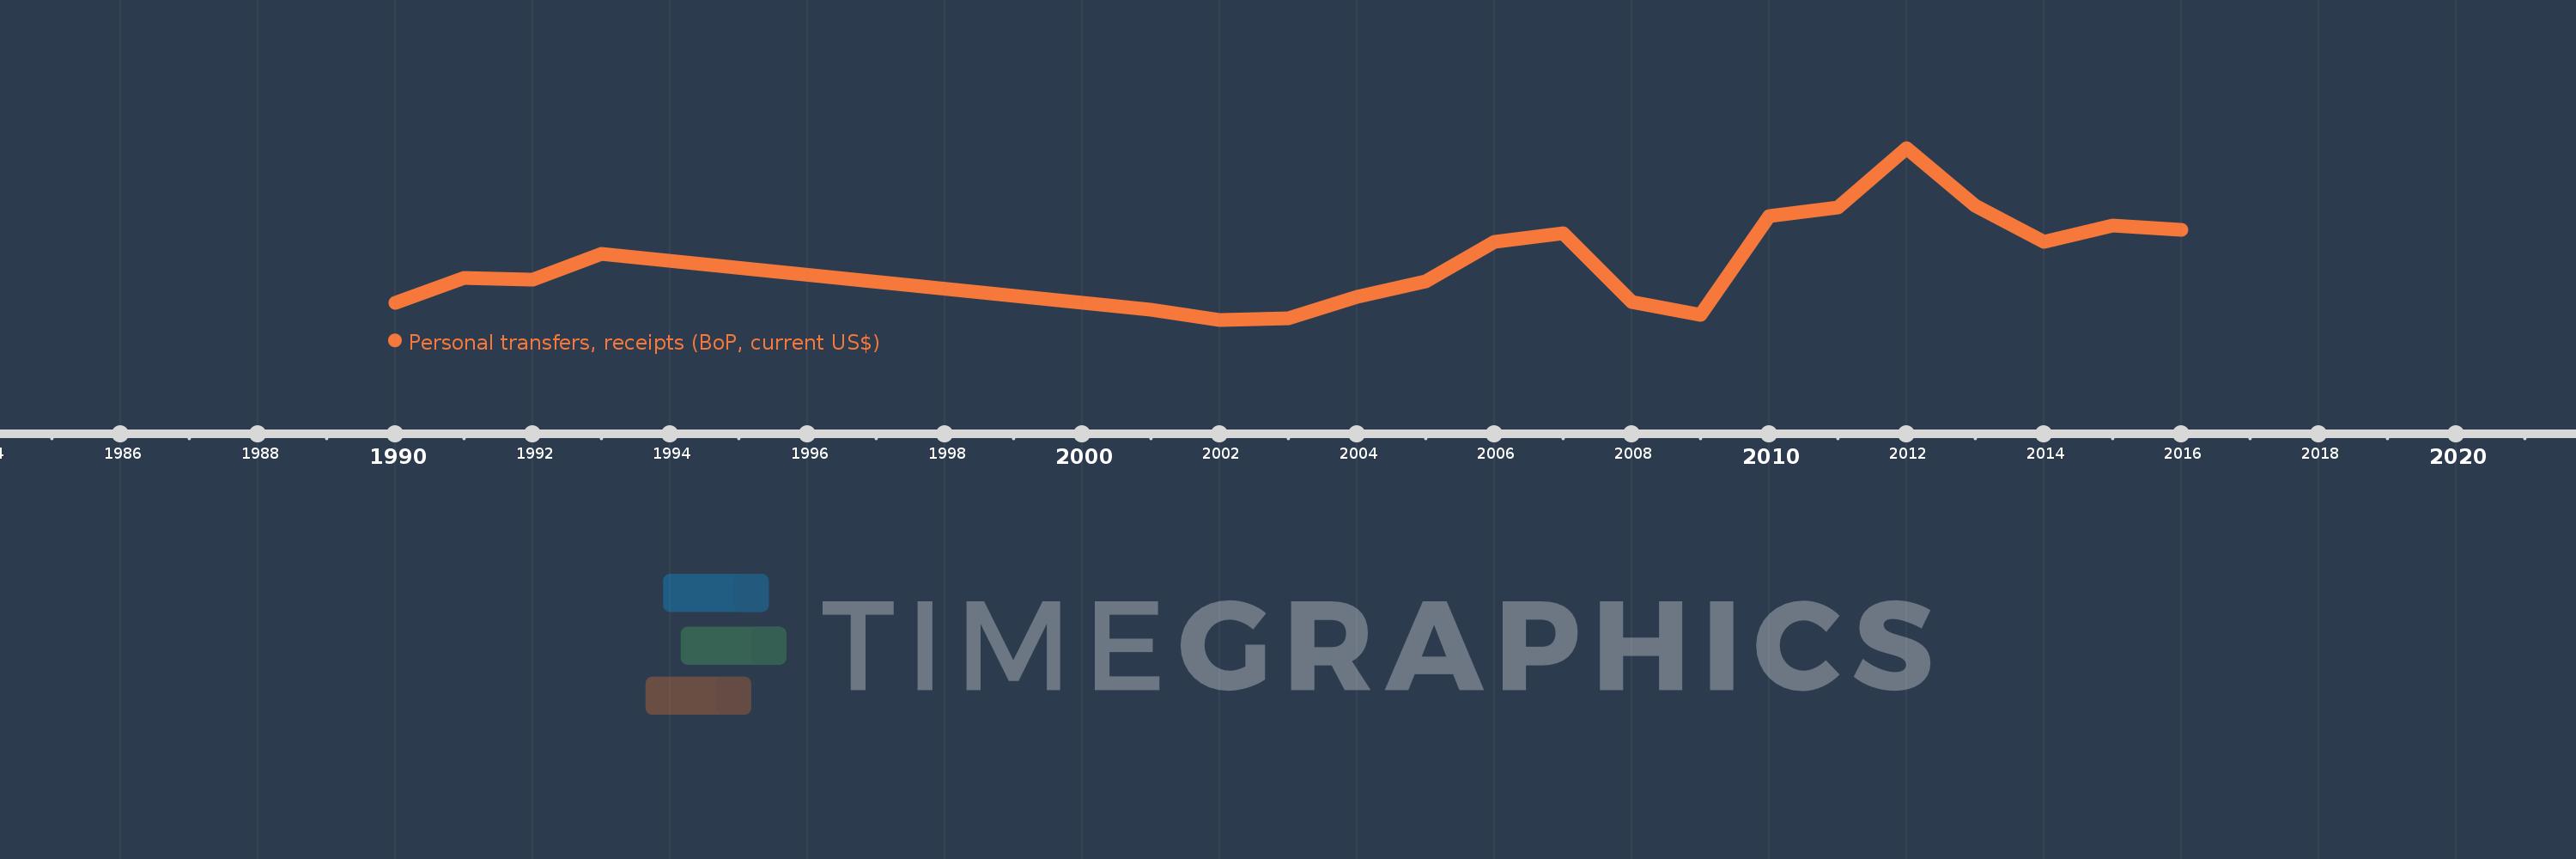
Personal transfers, receipts (BoP, current US$)
2016,2015,2014,2013,2012,2011,2010,2009,2008,2007,2006,2005,2004,2003,2002,2001,1993,1992,1991,1990
This statistics in other country:
Timeline:
This timeline shows a graph from 1990 to 2016 of Seychelles. No data until 1989. Number of actual observations by date: 20.
Source name:
World Development Indicators
Source organization:
International Monetary Fund, Balance of Payments Statistics Yearbook and data files.
Categories, topics:
Economy & Growth, Financial Sector
Last updated:
apr 23, 2017
Indicators value changes by year
Minimum:
1.62 mln
jan 1, 2002
Maximum:
24.339 mln
jan 1, 2012
At the date of observation
Value
Absolute change
Change from previous value
jan 1, 1990
3.905 mln
+3.905 mln
0.0%
jan 1, 1991
7.129 mln
+3.224 mln
82.56%
jan 1, 1992
6.942 mln
-187.427K
-2.63%
jan 1, 1993
10.371 mln
+3.429 mln
49.39%
jan 1, 2001
2.984 mln
-7.387 mln
-71.23%
jan 1, 2002
1.62 mln
-1.364 mln
-45.71%
jan 1, 2003
1.783 mln
+162.885K
10.05%
jan 1, 2004
4.696 mln
+2.913 mln
163.37%
jan 1, 2005
6.652 mln
+1.956 mln
41.66%
jan 1, 2006
11.916 mln
+5.264 mln
79.13%
jan 1, 2007
13.083 mln
+1.167 mln
9.79%
jan 1, 2008
3.967 mln
-9.116 mln
-69.68%
jan 1, 2009
2.275 mln
-1.692 mln
-42.66%
jan 1, 2010
15.283 mln
+13.008 mln
571.84%
jan 1, 2011
16.489 mln
+1.206 mln
7.89%
jan 1, 2012
24.339 mln
+7.85 mln
47.61%
jan 1, 2013
16.746 mln
-7.593 mln
-31.2%
jan 1, 2014
11.951 mln
-4.795 mln
-28.63%
jan 1, 2015
14.123 mln
+2.172 mln
18.17%
jan 1, 2016
13.462 mln
-660.373K
-4.68%
Ranking of countries by current statistics by years


Comments: