29
/
en
AIzaSyAYiBZKx7MnpbEhh9jyipgxe19OcubqV5w
April 1, 2024
226289
Portugal
PRT
true
2
1
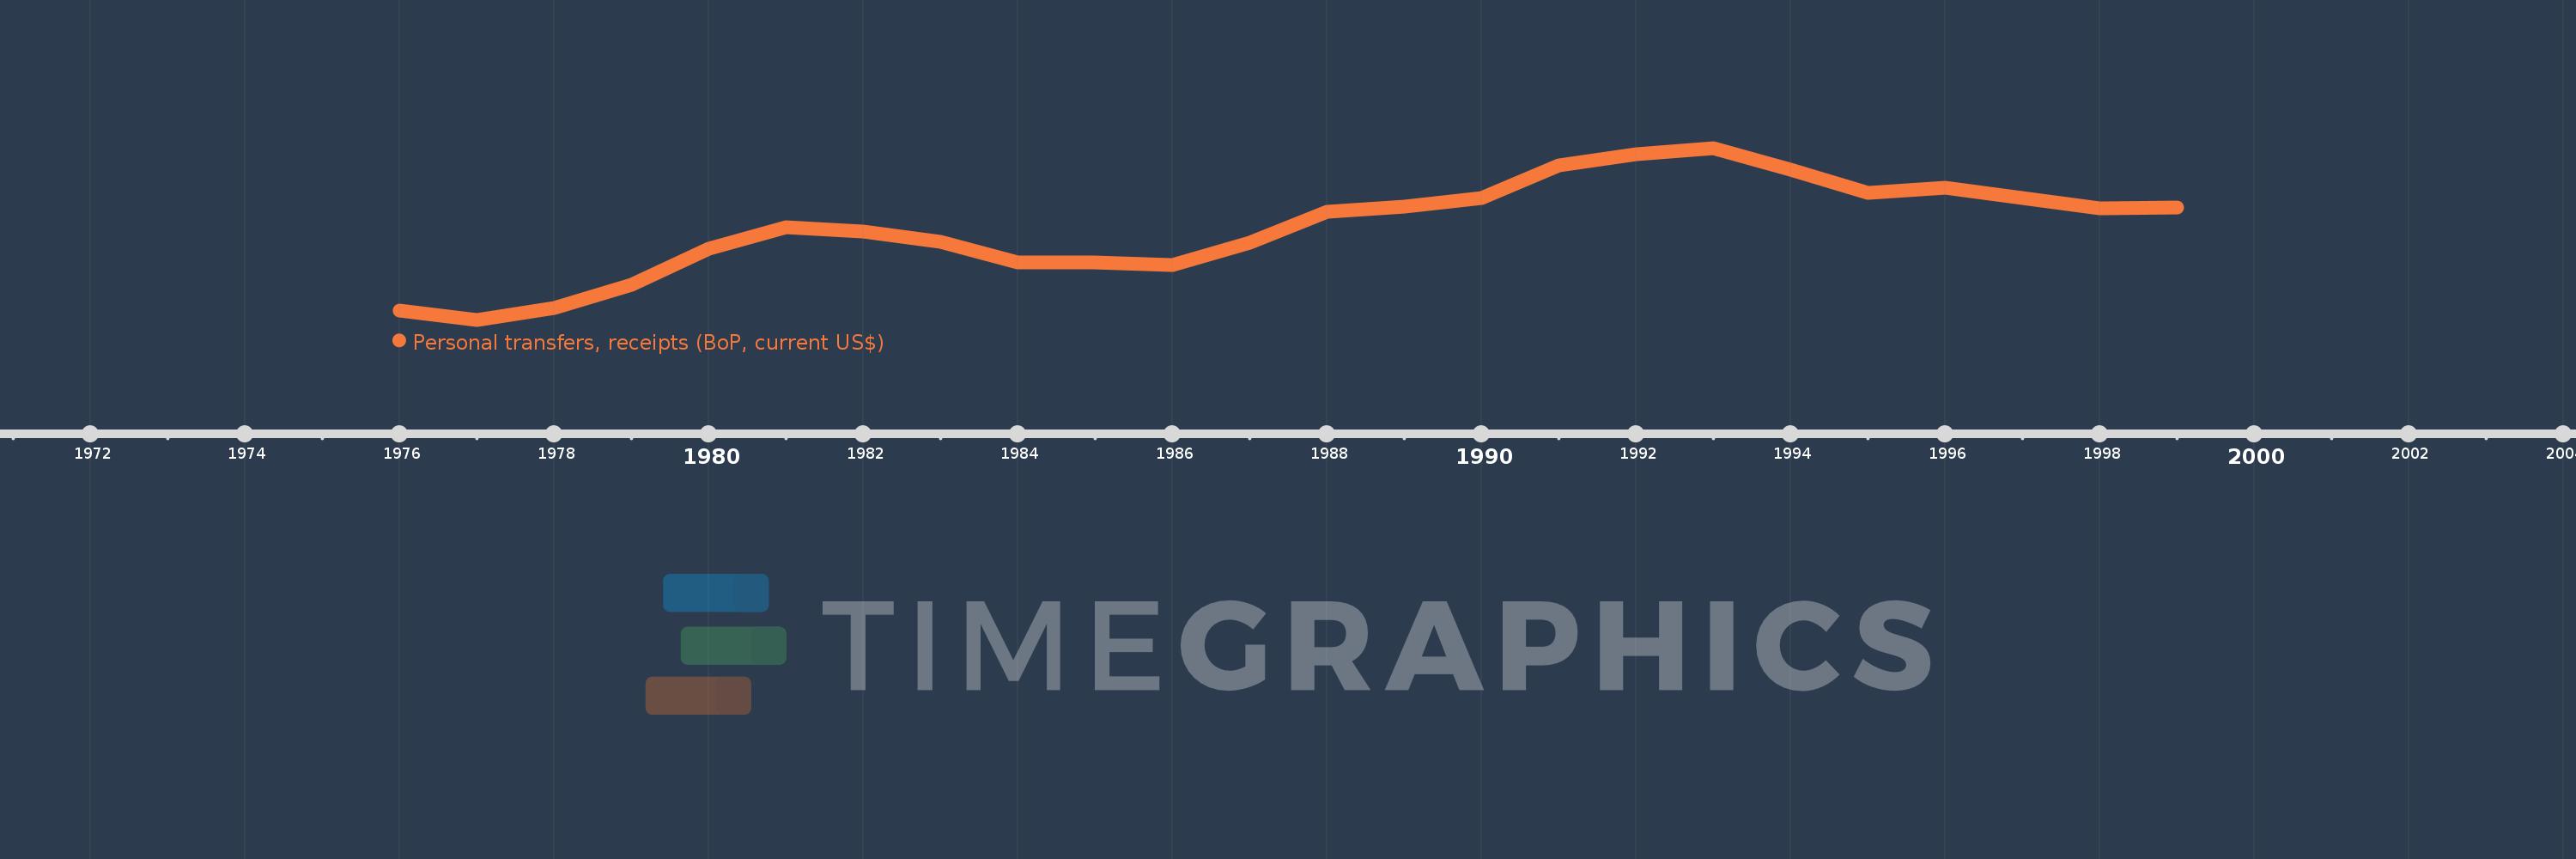
Personal transfers, receipts (BoP, current US$)
1999,1998,1997,1996,1995,1994,1993,1992,1991,1990,1989,1988,1987,1986,1985,1984,1983,1982,1981,1980,1979,1978,1977,1976
This statistics in other country:
Timeline:
This timeline shows a graph from 1976 to 1999 of Portugal. No data until 1975. Number of actual observations by date: 24.
Source name:
World Development Indicators
Source organization:
International Monetary Fund, Balance of Payments Statistics Yearbook and data files.
Categories, topics:
Economy & Growth, Financial Sector
Last updated:
apr 23, 2017
Indicators value changes by year
Minimum:
907.252 mln
jan 1, 1977
Maximum:
4.65 bln
jan 1, 1993
At the date of observation
Value
Absolute change
Change from previous value
jan 1, 1976
1.103 bln
+1.103 bln
0.0%
jan 1, 1977
907.252 mln
-195.633 mln
-17.74%
jan 1, 1978
1.173 bln
+265.688 mln
29.28%
jan 1, 1979
1.673 bln
+500.53 mln
42.67%
jan 1, 1980
2.454 bln
+780.6 mln
46.65%
jan 1, 1981
2.928 bln
+473.626 mln
19.3%
jan 1, 1982
2.831 bln
-96.723 mln
-3.3%
jan 1, 1983
2.601 bln
-229.917 mln
-8.12%
jan 1, 1984
2.15 bln
-450.661 mln
-17.33%
jan 1, 1985
2.152 bln
+1.422 mln
0.07%
jan 1, 1986
2.091 bln
-61.236 mln
-2.85%
jan 1, 1987
2.58 bln
+489.435 mln
23.41%
jan 1, 1988
3.254 bln
+673.753 mln
26.11%
jan 1, 1989
3.378 bln
+123.76 mln
3.8%
jan 1, 1990
3.562 bln
+184.115 mln
5.45%
jan 1, 1991
4.263 bln
+701.266 mln
19.69%
jan 1, 1992
4.517 bln
+254.339 mln
5.97%
jan 1, 1993
4.65 bln
+133.193 mln
2.95%
jan 1, 1994
4.179 bln
-471.27 mln
-10.13%
jan 1, 1995
3.669 bln
-509.799 mln
-12.2%
jan 1, 1996
3.793 bln
+123.381 mln
3.36%
jan 1, 1997
3.56 bln
-233.211 mln
-6.15%
jan 1, 1998
3.343 bln
-216.199 mln
-6.07%
jan 1, 1999
3.361 bln
+17.543 mln
0.52%
Ranking of countries by current statistics by years


Comments: