29
/
en
AIzaSyAYiBZKx7MnpbEhh9jyipgxe19OcubqV5w
April 1, 2024
262745
Thailand
THA
true
2
1
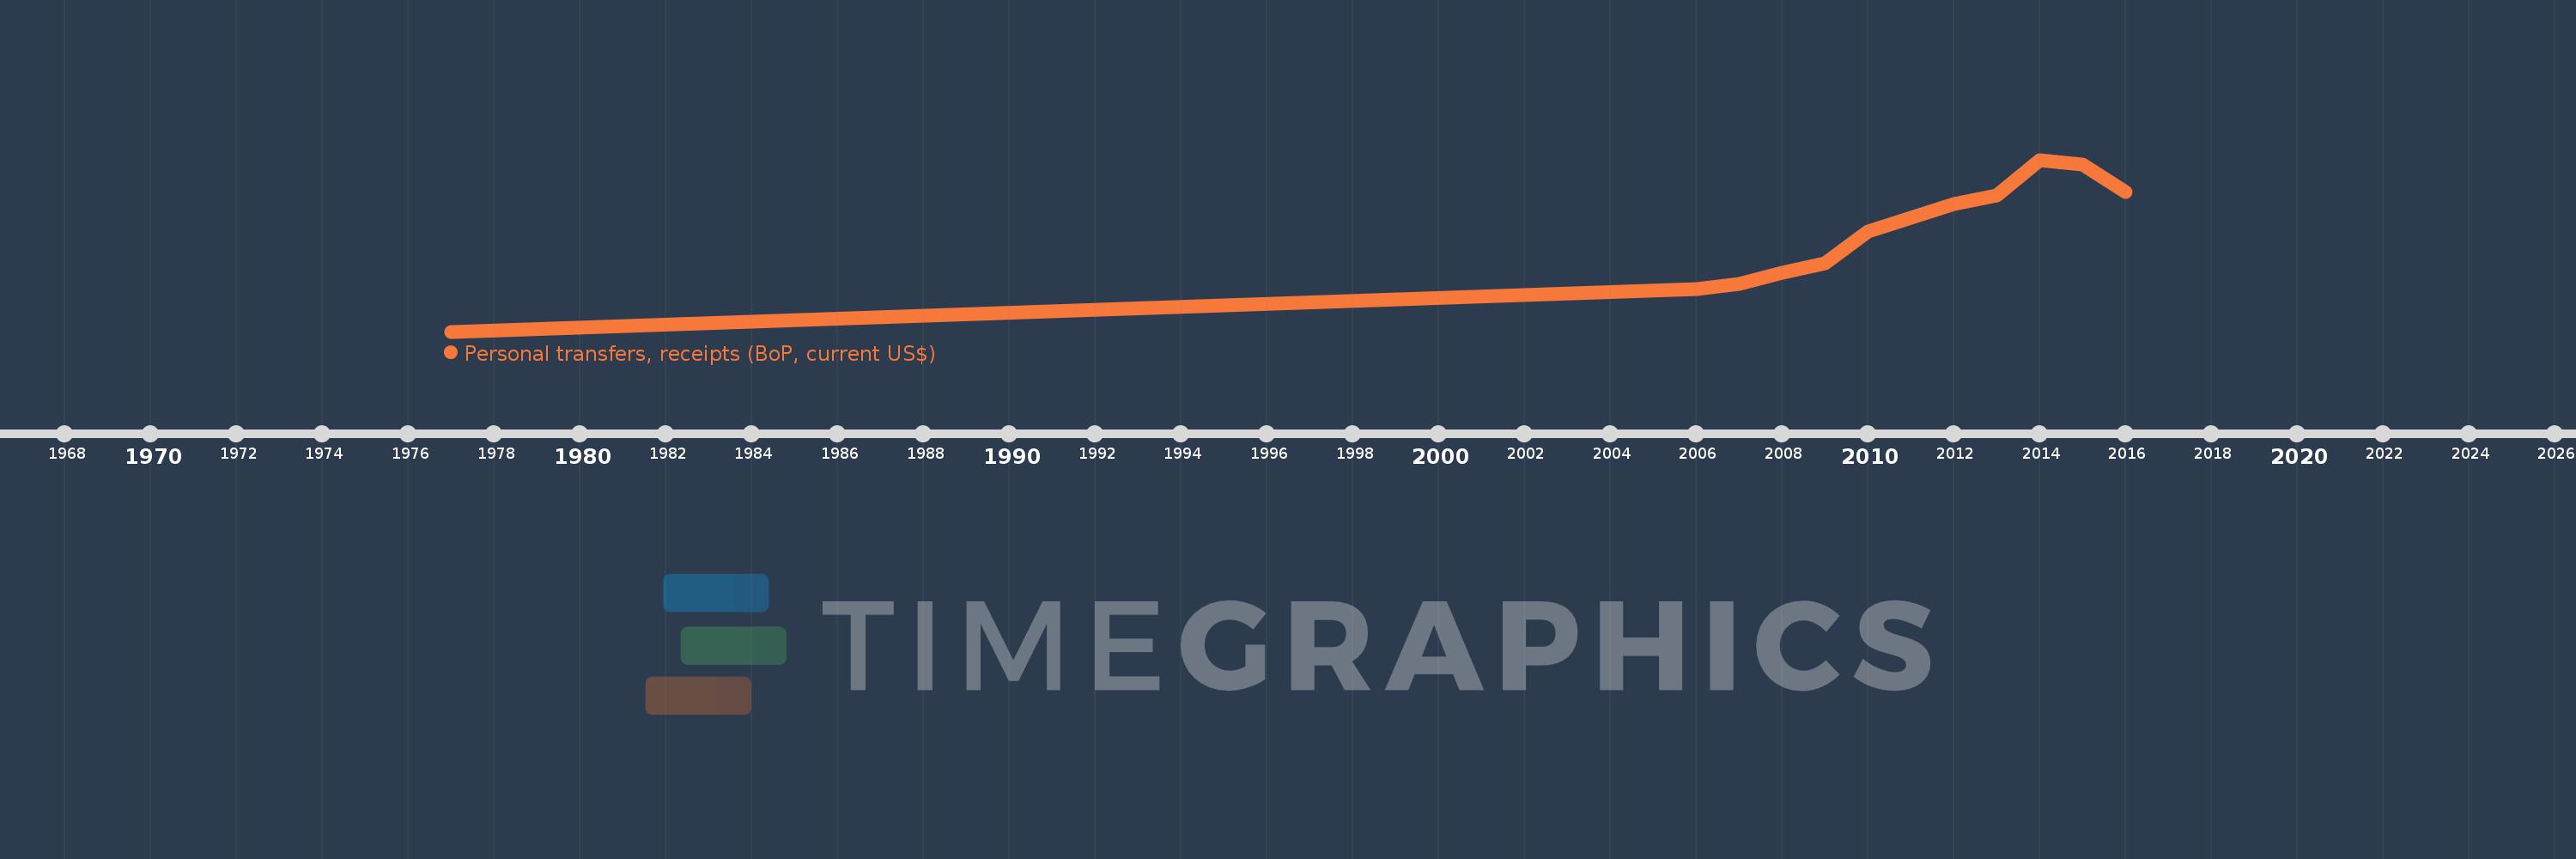
Personal transfers, receipts (BoP, current US$)
2016,2015,2014,2013,2012,2011,2010,2009,2008,2007,2006,1977
This statistics in other country:
Timeline:
This timeline shows a graph from 1977 to 2016 of Thailand. No data until 1976. Number of actual observations by date: 12.
Source name:
World Development Indicators
Source organization:
International Monetary Fund, Balance of Payments Statistics Yearbook and data files.
Categories, topics:
Economy & Growth, Financial Sector
Last updated:
apr 23, 2017
Indicators value changes by year
Minimum:
23.774 mln
jan 1, 1977
Maximum:
4.746 bln
jan 1, 2014
At the date of observation
Value
Absolute change
Change from previous value
jan 1, 1977
23.774 mln
+23.774 mln
0.0%
jan 1, 2006
1.187 bln
+1.163 bln
4.89K%
jan 1, 2007
1.333 bln
+146.34 mln
12.33%
jan 1, 2008
1.635 bln
+301.49 mln
22.61%
jan 1, 2009
1.898 bln
+263.56 mln
16.12%
jan 1, 2010
2.779 bln
+880.62 mln
46.39%
jan 1, 2011
3.158 bln
+378.7 mln
13.63%
jan 1, 2012
3.529 bln
+371.59 mln
11.77%
jan 1, 2013
3.755 bln
+225.53 mln
6.39%
jan 1, 2014
4.746 bln
+991.59 mln
26.41%
jan 1, 2015
4.615 bln
-130.97 mln
-2.76%
jan 1, 2016
3.865 bln
-750.38 mln
-16.26%
Ranking of countries by current statistics by years


Comments: