29
/
en
AIzaSyAYiBZKx7MnpbEhh9jyipgxe19OcubqV5w
April 1, 2024
196917
Micronesia, Fed. Sts.
FSM
true
2
1
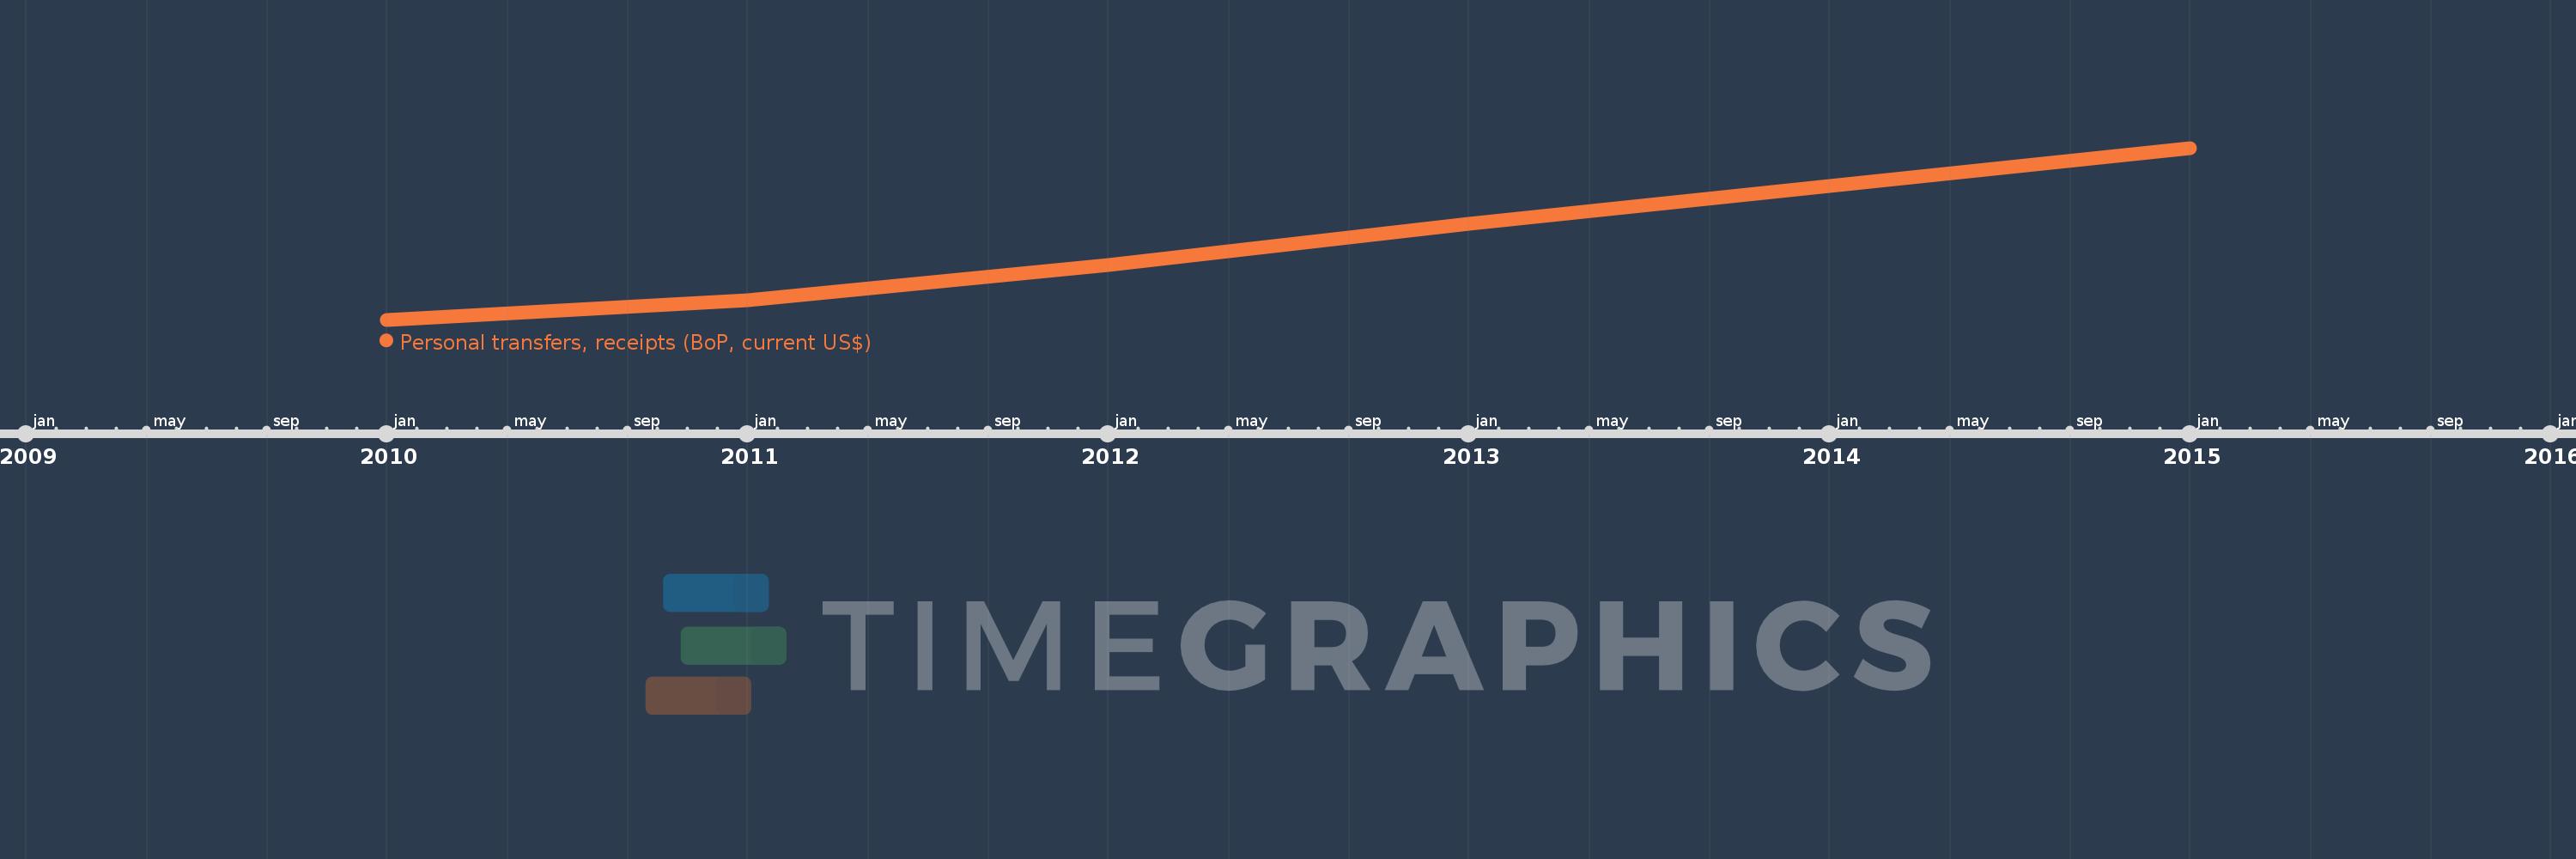
Personal transfers, receipts (BoP, current US$)
2015,2014,2013,2012,2011,2010
This statistics in other country:
Timeline:
This timeline shows a graph from 2010 to 2015 of Micronesia, Fed. Sts.. No data until 2009. Number of actual observations by date: 6.
Source name:
World Development Indicators
Source organization:
International Monetary Fund, Balance of Payments Statistics Yearbook and data files.
Categories, topics:
Economy & Growth, Financial Sector
Last updated:
apr 23, 2017
Indicators value changes by year
Minimum:
16.859 mln
jan 1, 2010
Maximum:
22.114 mln
jan 1, 2015
At the date of observation
Value
Absolute change
Change from previous value
jan 1, 2010
16.859 mln
+16.859 mln
0.0%
jan 1, 2011
17.461 mln
+602.3K
3.57%
jan 1, 2012
18.544 mln
+1.083 mln
6.2%
jan 1, 2013
19.796 mln
+1.251 mln
6.75%
jan 1, 2014
20.94 mln
+1.144 mln
5.78%
jan 1, 2015
22.114 mln
+1.174 mln
5.61%
Ranking of countries by current statistics by years


Comments: