29
/
en
AIzaSyAYiBZKx7MnpbEhh9jyipgxe19OcubqV5w
April 1, 2024
237585
Serbia
SRB
true
2
1
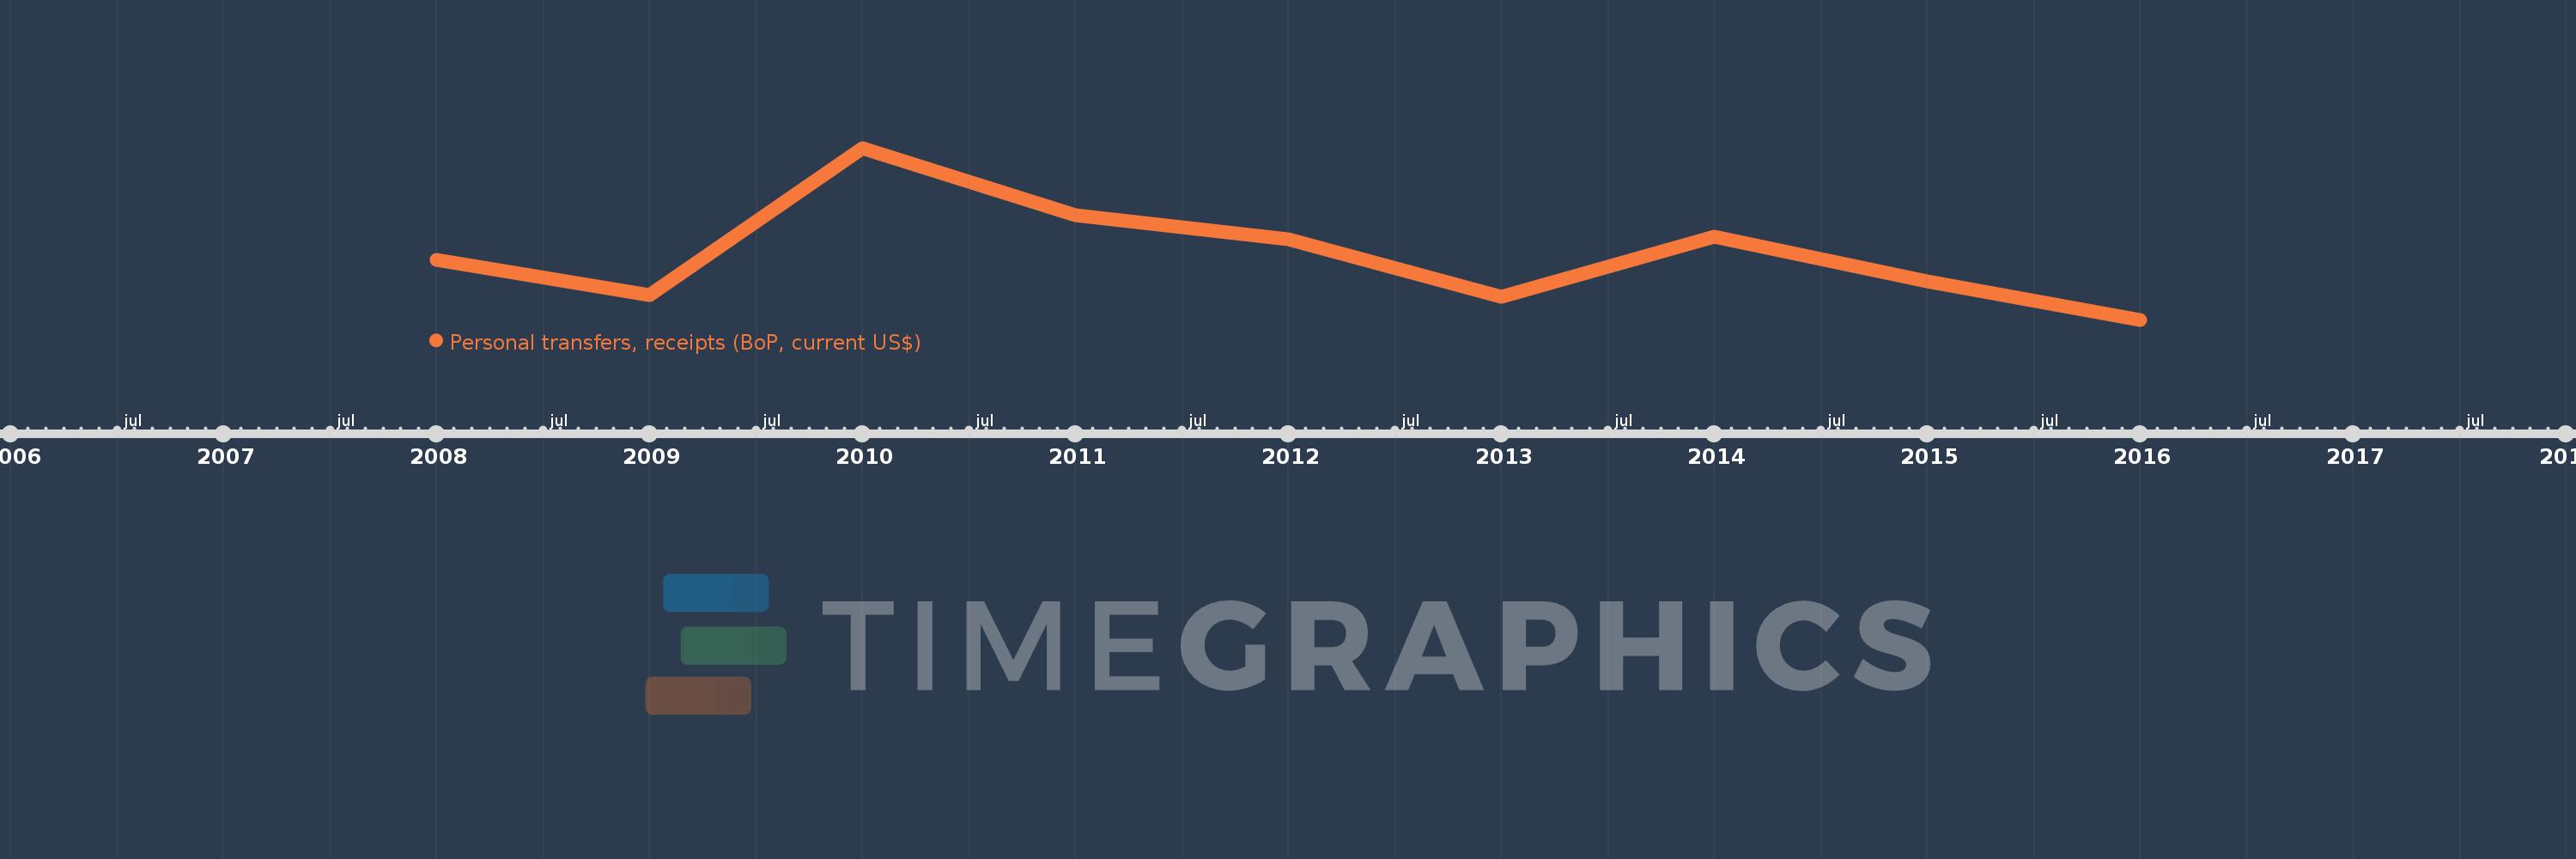
Personal transfers, receipts (BoP, current US$)
2016,2015,2014,2013,2012,2011,2010,2009,2008
This statistics in other country:
Timeline:
This timeline shows a graph from 2008 to 2016 of Serbia. No data until 2007. Number of actual observations by date: 9.
Source name:
World Development Indicators
Source organization:
International Monetary Fund, Balance of Payments Statistics Yearbook and data files.
Categories, topics:
Economy & Growth, Financial Sector
Last updated:
apr 23, 2017
Indicators value changes by year
Minimum:
3.166 bln
jan 1, 2016
Maximum:
4.464 bln
jan 1, 2010
At the date of observation
Value
Absolute change
Change from previous value
jan 1, 2008
3.62 bln
+3.62 bln
0.0%
jan 1, 2009
3.354 bln
-265.8 mln
-7.34%
jan 1, 2010
4.464 bln
+1.11 bln
33.09%
jan 1, 2011
3.954 bln
-509.948 mln
-11.42%
jan 1, 2012
3.773 bln
-180.359 mln
-4.56%
jan 1, 2013
3.338 bln
-435.708 mln
-11.55%
jan 1, 2014
3.792 bln
+454.044 mln
13.6%
jan 1, 2015
3.459 bln
-333.072 mln
-8.78%
jan 1, 2016
3.166 bln
-292.299 mln
-8.45%
Ranking of countries by current statistics by years


Comments: