29
/
en
AIzaSyAYiBZKx7MnpbEhh9jyipgxe19OcubqV5w
April 1, 2024
134484
France
FRA
true
2
1
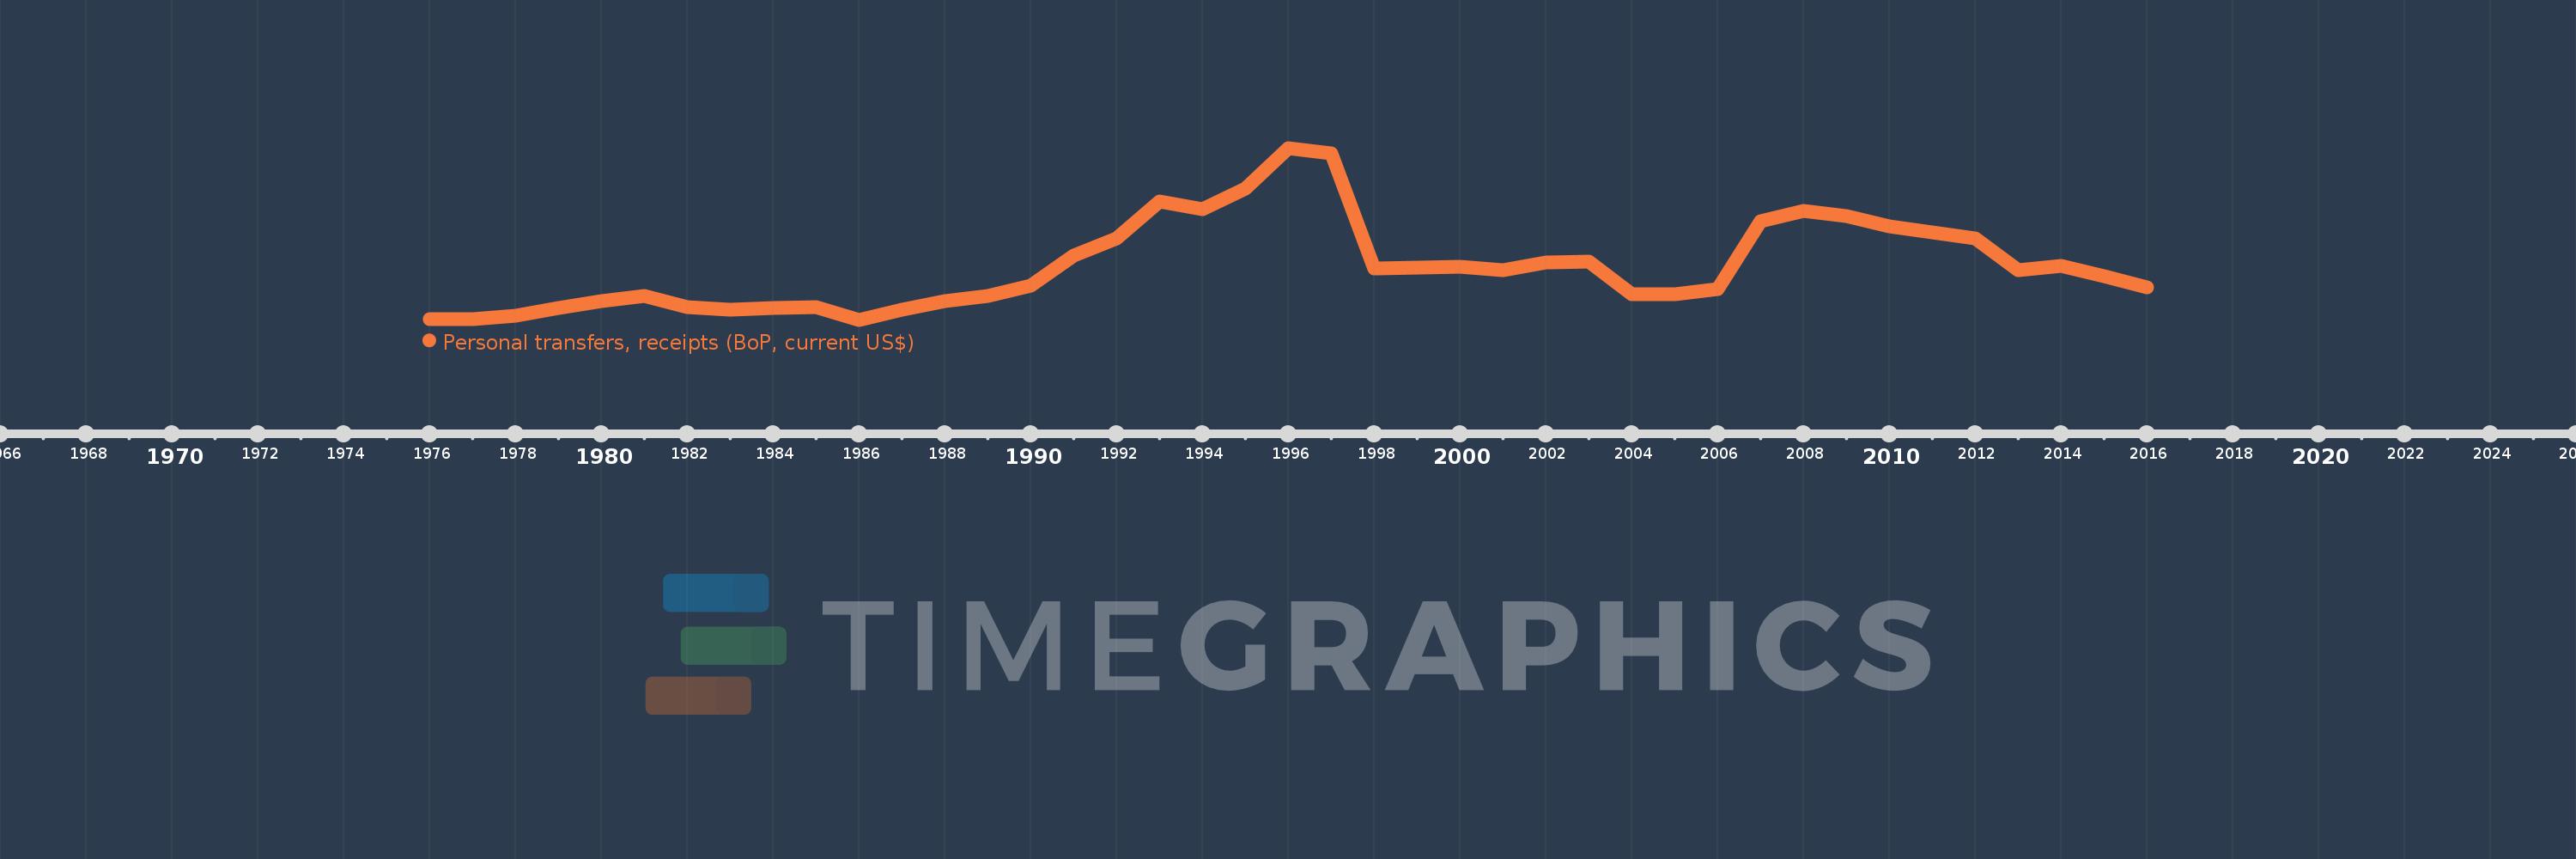
Personal transfers, receipts (BoP, current US$)
2016,2015,2014,2013,2012,2011,2010,2009,2008,2007,2006,2005,2004,2003,2002,2001,2000,1999,1998,1997,1996,1995,1994,1993,1992,1991,1990,1989,1988,1987,1986,1985,1984,1983,1982,1981,1980,1979,1978,1977,1976
This statistics in other country:
Timeline:
This timeline shows a graph from 1976 to 2016 of France. No data until 1975. Number of actual observations by date: 41.
Source name:
World Development Indicators
Source organization:
International Monetary Fund, Balance of Payments Statistics Yearbook and data files.
Categories, topics:
Economy & Growth, Financial Sector
Last updated:
apr 23, 2017
Indicators value changes by year
Minimum:
230.501 mln
jan 1, 1986
Maximum:
1.782 bln
jan 1, 1996
At the date of observation
Value
Absolute change
Change from previous value
jan 1, 1976
238.244 mln
+238.244 mln
0.0%
jan 1, 1977
237.186 mln
-1.058 mln
-0.44%
jan 1, 1978
269.224 mln
+32.038 mln
13.51%
jan 1, 1979
337.879 mln
+68.655 mln
25.5%
jan 1, 1980
397.231 mln
+59.352 mln
17.57%
jan 1, 1981
447.485 mln
+50.254 mln
12.65%
jan 1, 1982
346.81 mln
-100.675 mln
-22.5%
jan 1, 1983
321.997 mln
-24.813 mln
-7.15%
jan 1, 1984
336.418 mln
+14.421 mln
4.48%
jan 1, 1985
342.214 mln
+5.796 mln
1.72%
jan 1, 1986
230.501 mln
-111.713 mln
-32.64%
jan 1, 1987
321.966 mln
+91.465 mln
39.68%
jan 1, 1988
398.577 mln
+76.611 mln
23.79%
jan 1, 1989
444.719 mln
+46.143 mln
11.58%
jan 1, 1990
541.425 mln
+96.706 mln
21.75%
jan 1, 1991
807.458 mln
+266.033 mln
49.14%
jan 1, 1992
967.942 mln
+160.484 mln
19.88%
jan 1, 1993
1.3 bln
+332.525 mln
34.35%
jan 1, 1994
1.231 bln
-69.635 mln
-5.35%
jan 1, 1995
1.413 bln
+181.983 mln
14.79%
jan 1, 1996
1.782 bln
+369.024 mln
26.12%
jan 1, 1997
1.73 bln
-52.08 mln
-2.92%
jan 1, 1998
694.961 mln
-1.035 bln
-59.82%
jan 1, 1999
704.264 mln
+9.303 mln
1.34%
jan 1, 2000
706.38 mln
+2.116 mln
0.3%
jan 1, 2001
679.067 mln
-27.313 mln
-3.87%
jan 1, 2002
750.304 mln
+71.237 mln
10.49%
jan 1, 2003
759.048 mln
+8.743 mln
1.17%
jan 1, 2004
459.003 mln
-300.044 mln
-39.53%
jan 1, 2005
459.897 mln
+893.303K
0.19%
jan 1, 2006
510.999 mln
+51.103 mln
11.11%
jan 1, 2007
1.117 bln
+605.605 mln
118.51%
jan 1, 2008
1.21 bln
+93.014 mln
8.33%
jan 1, 2009
1.17 bln
-39.265 mln
-3.25%
jan 1, 2010
1.071 bln
-99.822 mln
-8.53%
jan 1, 2011
1.022 bln
-48.725 mln
-4.55%
jan 1, 2012
964.777 mln
-57.03 mln
-5.58%
jan 1, 2013
678.614 mln
-286.164 mln
-29.66%
jan 1, 2014
717.143 mln
+38.53 mln
5.68%
jan 1, 2015
627.118 mln
-90.026 mln
-12.55%
jan 1, 2016
523.536 mln
-103.582 mln
-16.52%
Ranking of countries by current statistics by years


Comments: