29
/
en
AIzaSyAYiBZKx7MnpbEhh9jyipgxe19OcubqV5w
April 1, 2024
148381
Guyana
GUY
true
2
1
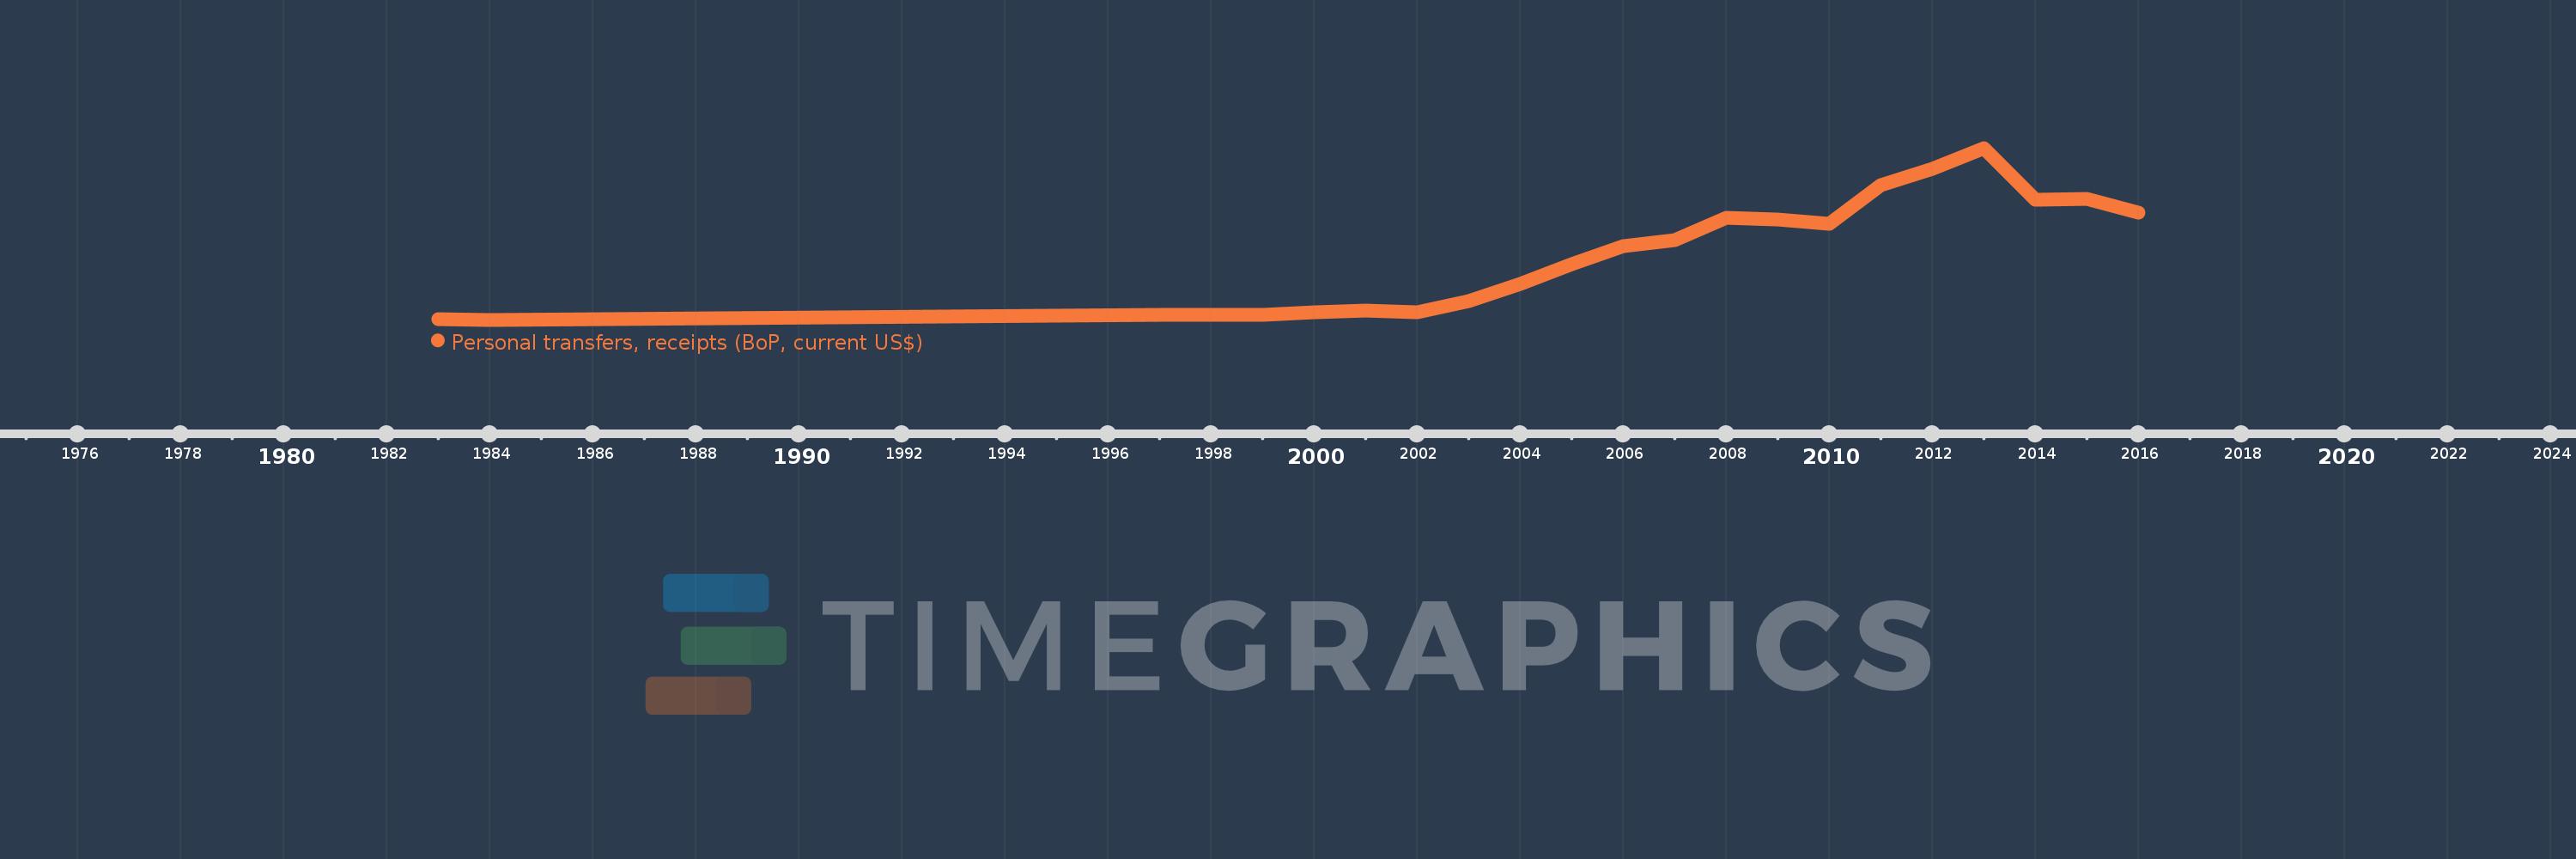
Personal transfers, receipts (BoP, current US$)
2016,2015,2014,2013,2012,2011,2010,2009,2008,2007,2006,2005,2004,2003,2002,2001,2000,1999,1998,1997,1984,1983
This statistics in other country:
Timeline:
This timeline shows a graph from 1983 to 2016 of Guyana. No data until 1982. Number of actual observations by date: 22.
Source name:
World Development Indicators
Source organization:
International Monetary Fund, Balance of Payments Statistics Yearbook and data files.
Categories, topics:
Economy & Growth, Financial Sector
Last updated:
apr 23, 2017
Indicators value changes by year
Minimum:
1.167 mln
jan 1, 1984
Maximum:
469.258 mln
jan 1, 2013
At the date of observation
Value
Absolute change
Change from previous value
jan 1, 1983
2.3 mln
+2.3 mln
0.0%
jan 1, 1984
1.167 mln
-1.133 mln
-49.28%
jan 1, 1997
14.6 mln
+13.433 mln
1.15K%
jan 1, 1998
15.0 mln
+400.0K
2.74%
jan 1, 1999
14.0 mln
-1000.0K
-6.67%
jan 1, 2000
20.5 mln
+6.5 mln
46.43%
jan 1, 2001
27.3 mln
+6.8 mln
33.17%
jan 1, 2002
22.3 mln
-5.0 mln
-18.32%
jan 1, 2003
51.0 mln
+28.7 mln
128.7%
jan 1, 2004
99.3 mln
+48.3 mln
94.71%
jan 1, 2005
153.009 mln
+53.709 mln
54.09%
jan 1, 2006
201.289 mln
+48.28 mln
31.55%
jan 1, 2007
218.076 mln
+16.787 mln
8.34%
jan 1, 2008
278.496 mln
+60.42 mln
27.71%
jan 1, 2009
273.896 mln
-4.6 mln
-1.65%
jan 1, 2010
262.066 mln
-11.83 mln
-4.32%
jan 1, 2011
367.805 mln
+105.74 mln
40.35%
jan 1, 2012
412.2 mln
+44.395 mln
12.07%
jan 1, 2013
469.258 mln
+57.058 mln
13.84%
jan 1, 2014
328.153 mln
-141.106 mln
-30.07%
jan 1, 2015
329.658 mln
+1.505 mln
0.46%
jan 1, 2016
293.505 mln
-36.153 mln
-10.97%
Ranking of countries by current statistics by years


Comments: