29
/
en
AIzaSyAYiBZKx7MnpbEhh9jyipgxe19OcubqV5w
April 1, 2024
212167
Niger
NER
true
2
1
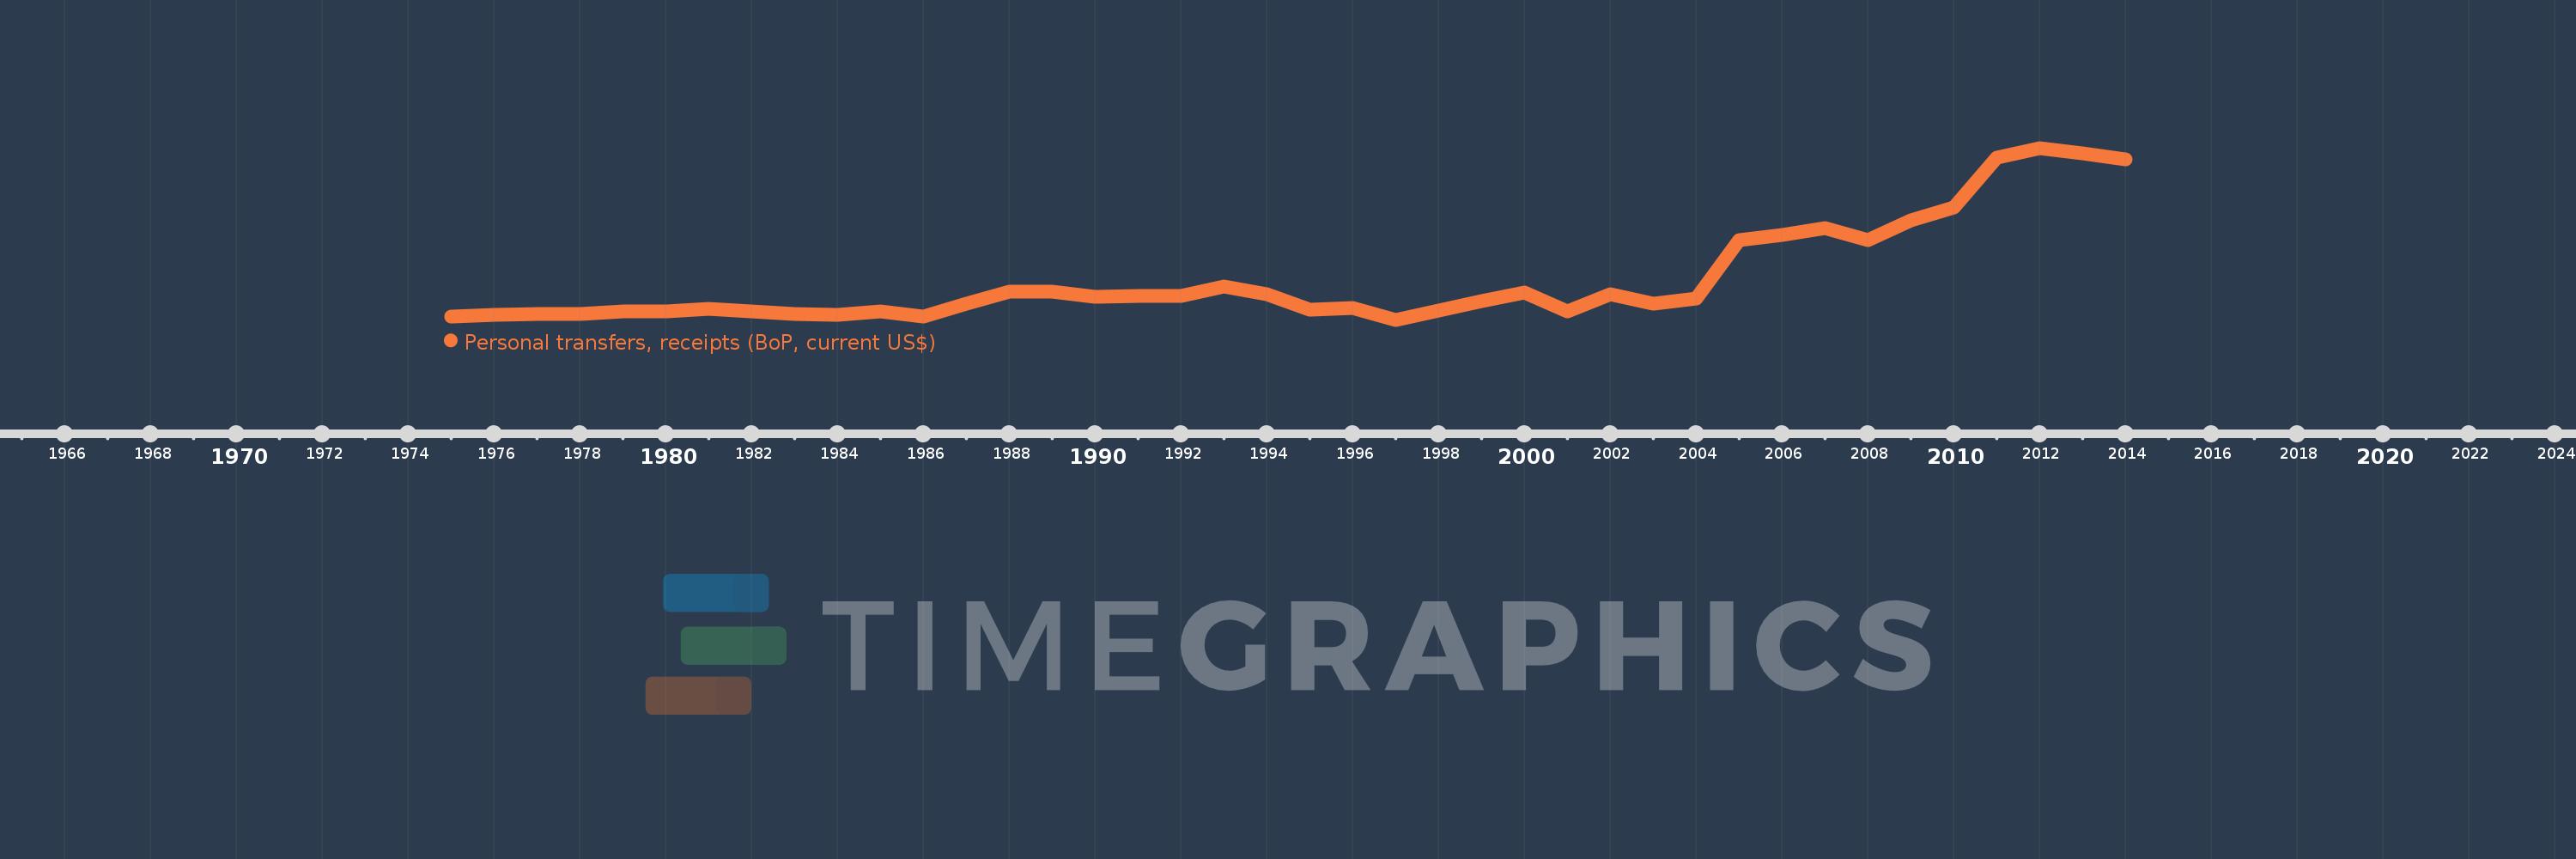
Personal transfers, receipts (BoP, current US$)
2014,2013,2012,2011,2010,2009,2008,2007,2006,2005,2004,2003,2002,2001,2000,1999,1997,1996,1995,1994,1993,1992,1991,1990,1989,1988,1987,1986,1985,1984,1983,1982,1981,1980,1979,1978,1977,1976,1975
This statistics in other country:
Timeline:
This timeline shows a graph from 1975 to 2014 of Niger. No data until 1974. Number of actual observations by date: 39.
Source name:
World Development Indicators
Source organization:
International Monetary Fund, Balance of Payments Statistics Yearbook and data files.
Categories, topics:
Economy & Growth, Financial Sector
Last updated:
apr 23, 2017
Indicators value changes by year
Minimum:
187.664K
jan 1, 1997
Maximum:
92.049 mln
jan 1, 2012
At the date of observation
Value
Absolute change
Change from previous value
jan 1, 1975
2.073 mln
+2.073 mln
0.0%
jan 1, 1976
3.005 mln
+931.872K
44.95%
jan 1, 1977
3.356 mln
+351.392K
11.69%
jan 1, 1978
3.26 mln
-96.001K
-2.86%
jan 1, 1979
4.662 mln
+1.402 mln
42.99%
jan 1, 1980
4.593 mln
-69.11K
-1.48%
jan 1, 1981
5.883 mln
+1.29 mln
28.09%
jan 1, 1982
4.578 mln
-1.305 mln
-22.18%
jan 1, 1983
3.354 mln
-1.224 mln
-26.75%
jan 1, 1984
2.984 mln
-369.823K
-11.03%
jan 1, 1985
4.479 mln
+1.495 mln
50.1%
jan 1, 1986
2.101 mln
-2.377 mln
-53.08%
jan 1, 1987
8.634 mln
+6.533 mln
310.9%
jan 1, 1988
15.353 mln
+6.719 mln
77.82%
jan 1, 1989
15.102 mln
-250.89K
-1.63%
jan 1, 1990
12.561 mln
-2.541 mln
-16.82%
jan 1, 1991
13.064 mln
+503.686K
4.01%
jan 1, 1992
12.871 mln
-193.481K
-1.48%
jan 1, 1993
18.006 mln
+5.135 mln
39.89%
jan 1, 1994
13.886 mln
-4.12 mln
-22.88%
jan 1, 1995
5.684 mln
-8.202 mln
-59.06%
jan 1, 1996
6.343 mln
+658.413K
11.58%
jan 1, 1997
187.664K
-6.155 mln
-97.04%
jan 1, 1999
10.282 mln
+10.095 mln
5.38K%
jan 1, 2000
14.744 mln
+4.462 mln
43.4%
jan 1, 2001
4.552 mln
-10.192 mln
-69.13%
jan 1, 2002
13.766 mln
+9.214 mln
202.41%
jan 1, 2003
8.718 mln
-5.048 mln
-36.67%
jan 1, 2004
11.521 mln
+2.803 mln
32.16%
jan 1, 2005
42.873 mln
+31.352 mln
272.13%
jan 1, 2006
45.516 mln
+2.643 mln
6.16%
jan 1, 2007
49.064 mln
+3.548 mln
7.8%
jan 1, 2008
42.684 mln
-6.38 mln
-13.0%
jan 1, 2009
53.103 mln
+10.419 mln
24.41%
jan 1, 2010
60.334 mln
+7.231 mln
13.62%
jan 1, 2011
86.699 mln
+26.365 mln
43.7%
jan 1, 2012
92.049 mln
+5.35 mln
6.17%
jan 1, 2013
88.951 mln
-3.098 mln
-3.37%
jan 1, 2014
86.017 mln
-2.934 mln
-3.3%
Ranking of countries by current statistics by years


Comments: