29
/
en
AIzaSyAYiBZKx7MnpbEhh9jyipgxe19OcubqV5w
April 1, 2024
230217
Russian Federation
RUS
true
2
1
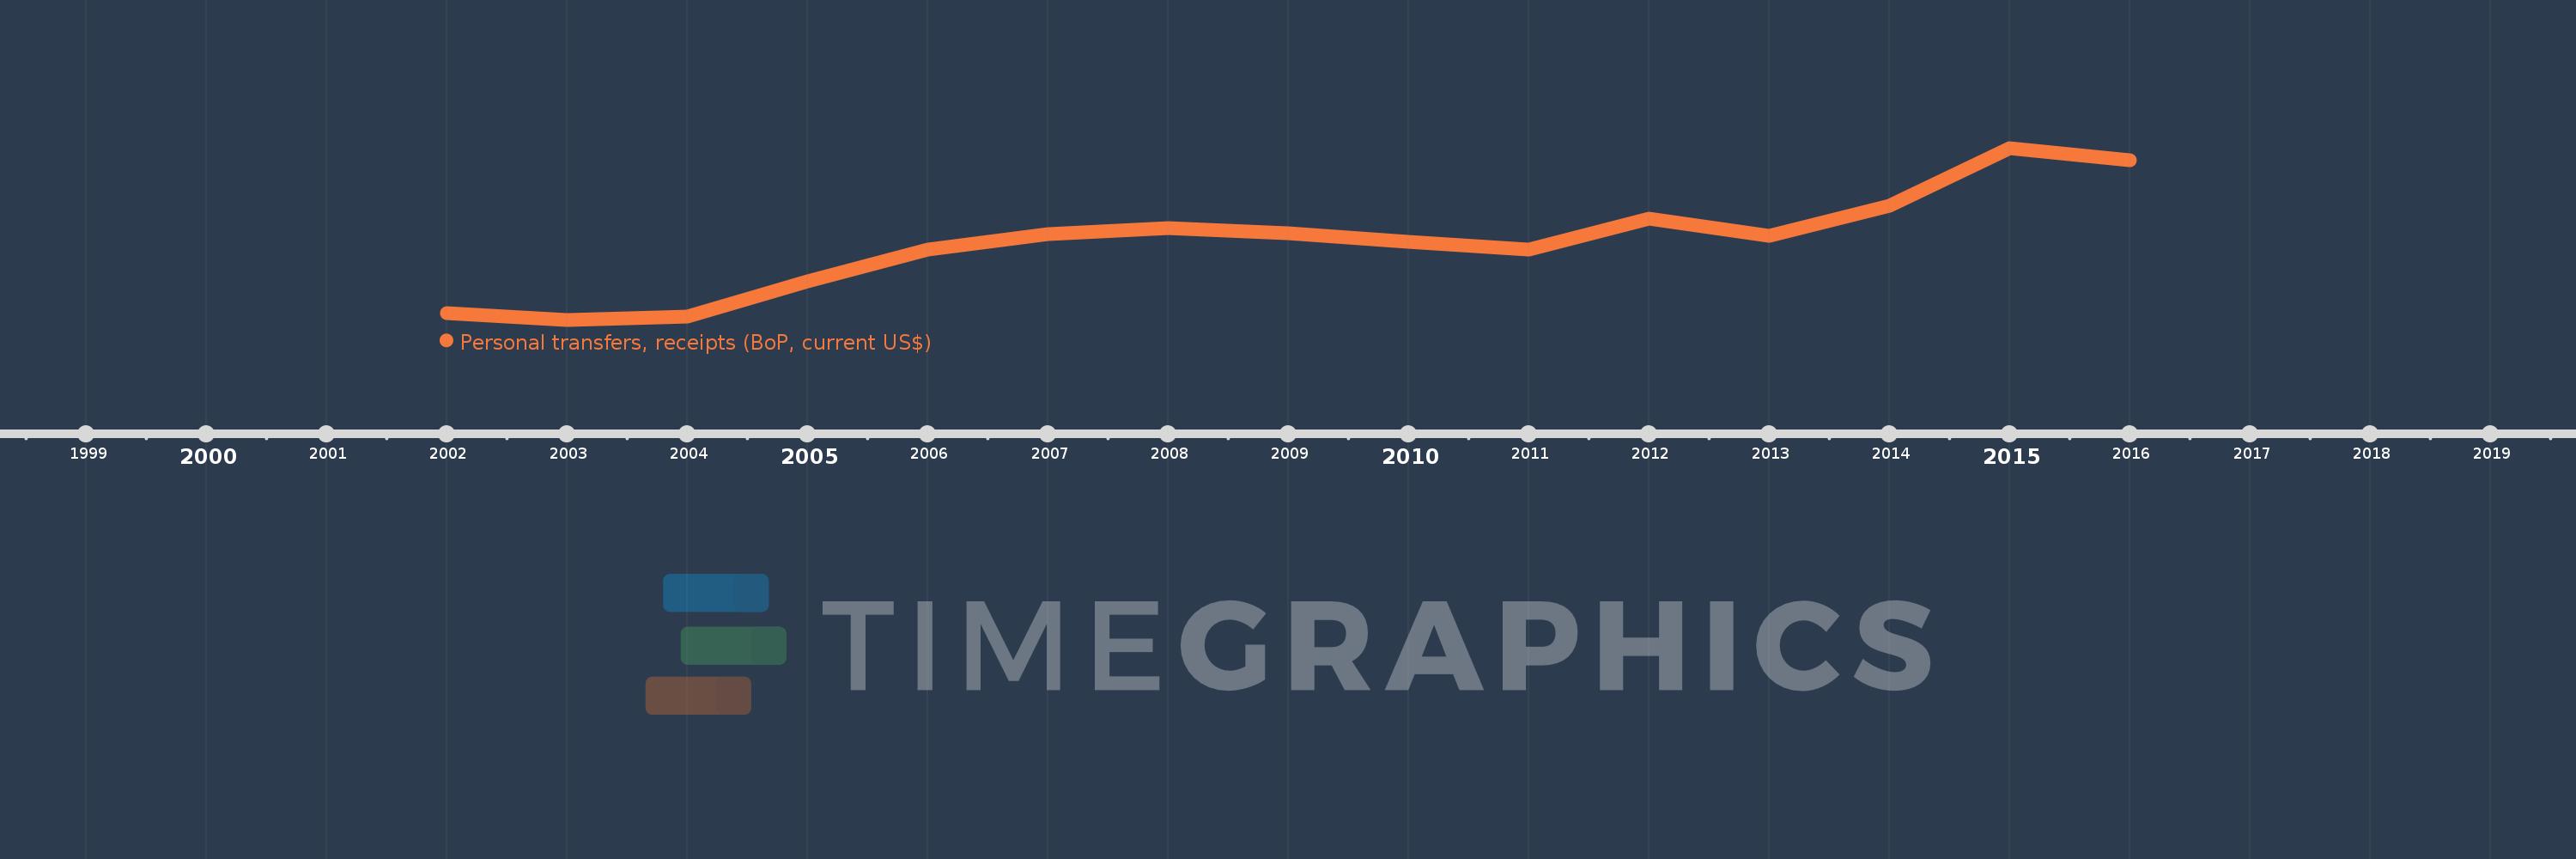
Personal transfers, receipts (BoP, current US$)
2016,2015,2014,2013,2012,2011,2010,2009,2008,2007,2006,2005,2004,2003,2002
This statistics in other country:
Timeline:
This timeline shows a graph from 2002 to 2016 of Russian Federation. No data until 2001. Number of actual observations by date: 15.
Source name:
World Development Indicators
Source organization:
International Monetary Fund, Balance of Payments Statistics Yearbook and data files.
Categories, topics:
Economy & Growth, Financial Sector
Last updated:
apr 23, 2017
Indicators value changes by year
Minimum:
231.67 mln
jan 1, 2003
Maximum:
3.637 bln
jan 1, 2015
At the date of observation
Value
Absolute change
Change from previous value
jan 1, 2002
362.7 mln
+362.7 mln
0.0%
jan 1, 2003
231.67 mln
-131.03 mln
-36.13%
jan 1, 2004
300.18 mln
+68.51 mln
29.57%
jan 1, 2005
1.0 bln
+700.22 mln
233.27%
jan 1, 2006
1.629 bln
+629.03 mln
62.88%
jan 1, 2007
1.921 bln
+292.0 mln
17.92%
jan 1, 2008
2.054 bln
+132.21 mln
6.88%
jan 1, 2009
1.945 bln
-108.43 mln
-5.28%
jan 1, 2010
1.779 bln
-165.91 mln
-8.53%
jan 1, 2011
1.631 bln
-148.67 mln
-8.36%
jan 1, 2012
2.232 bln
+601.41 mln
36.88%
jan 1, 2013
1.903 bln
-328.65 mln
-14.72%
jan 1, 2014
2.495 bln
+591.43 mln
31.07%
jan 1, 2015
3.637 bln
+1.143 bln
45.8%
jan 1, 2016
3.401 bln
-236.22 mln
-6.49%
Ranking of countries by current statistics by years


Comments: