29
/
en
AIzaSyAYiBZKx7MnpbEhh9jyipgxe19OcubqV5w
April 1, 2024
283980
West Bank and Gaza
PSE
true
2
1
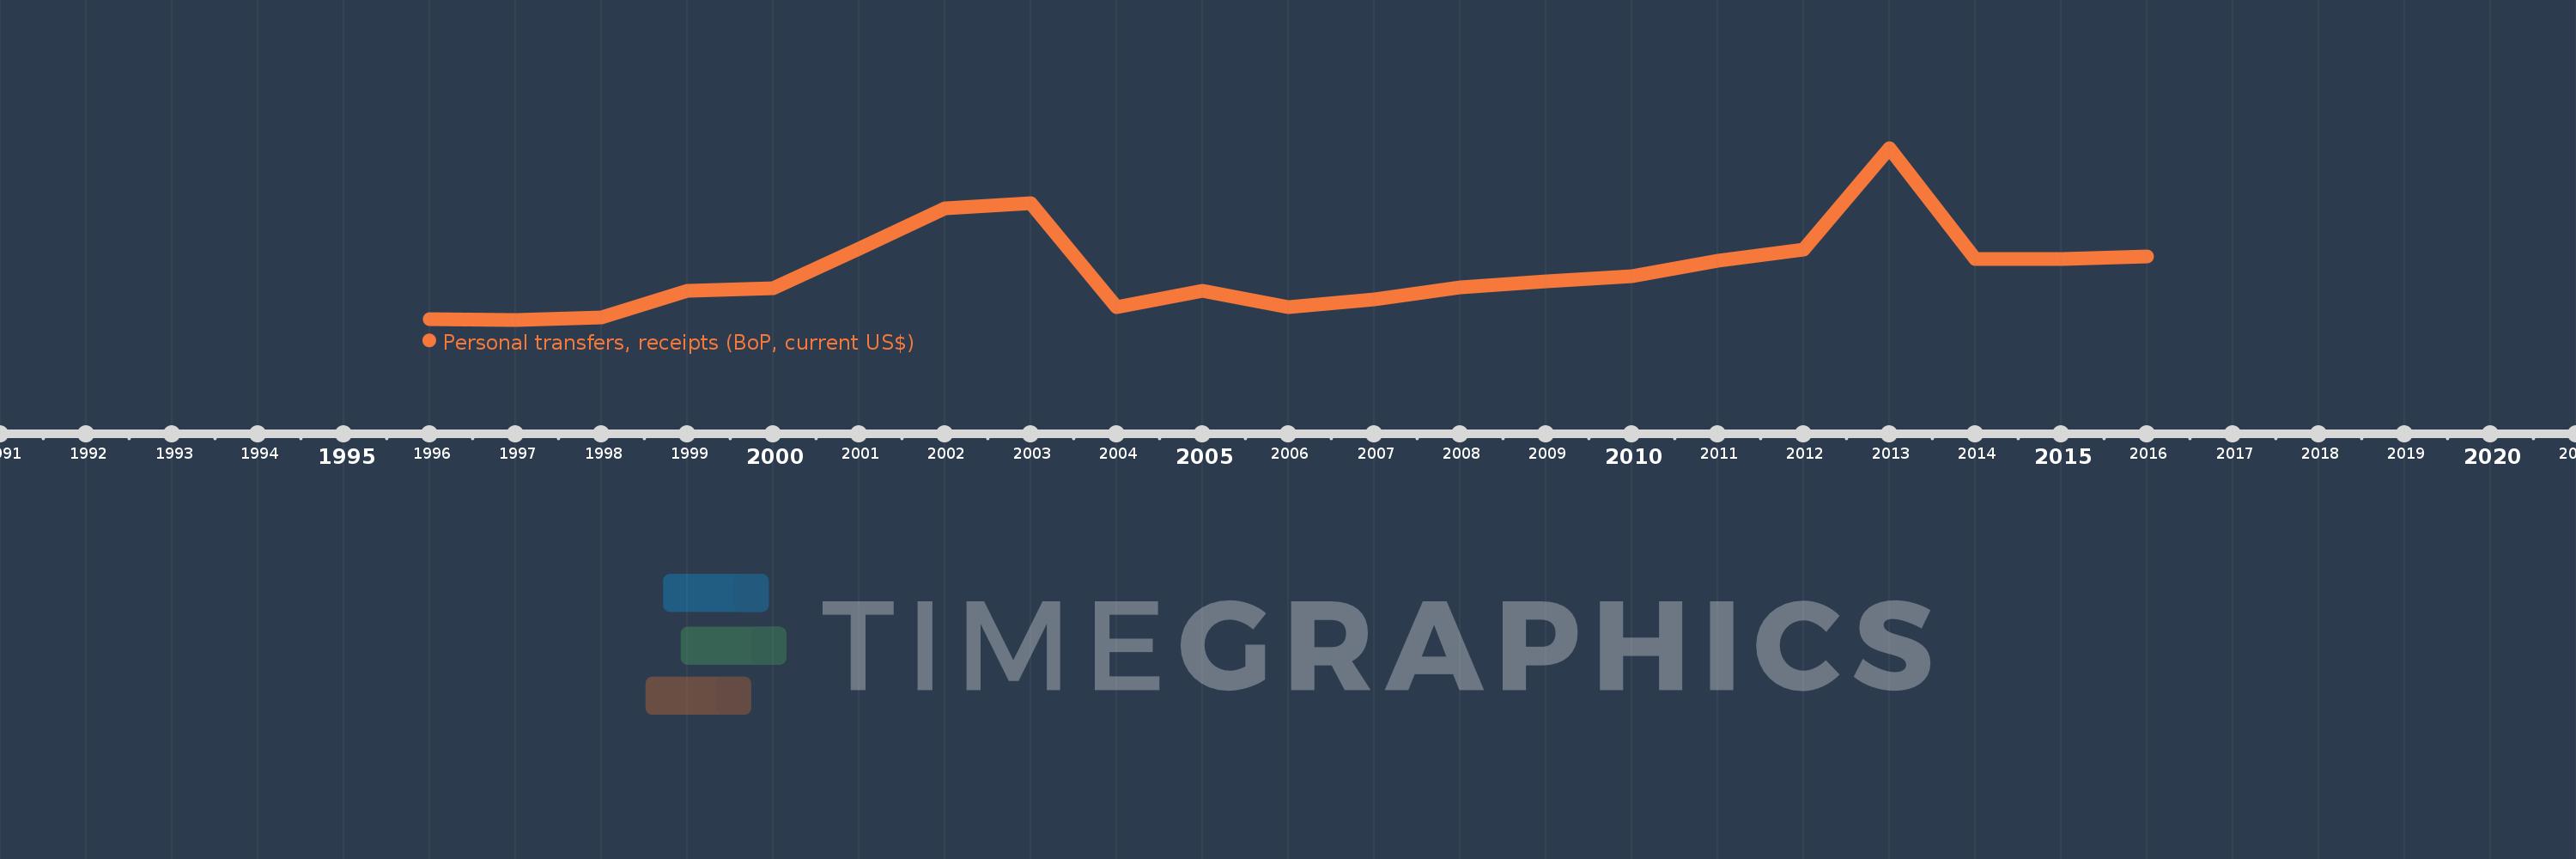
Personal transfers, receipts (BoP, current US$)
2016,2015,2014,2013,2012,2011,2010,2009,2008,2007,2006,2005,2004,2003,2002,2001,2000,1999,1998,1997,1996
This statistics in other country:
Timeline:
This timeline shows a graph from 1996 to 2016 of West Bank and Gaza. No data until 1995. Number of actual observations by date: 21.
Source name:
World Development Indicators
Source organization:
International Monetary Fund, Balance of Payments Statistics Yearbook and data files.
Categories, topics:
Economy & Growth, Financial Sector
Last updated:
apr 23, 2017
Indicators value changes by year
Minimum:
51.3 mln
jan 1, 1997
Maximum:
914.085 mln
jan 1, 2013
At the date of observation
Value
Absolute change
Change from previous value
jan 1, 1996
53.9 mln
+53.9 mln
0.0%
jan 1, 1997
51.3 mln
-2.6 mln
-4.82%
jan 1, 1998
62.4 mln
+11.1 mln
21.64%
jan 1, 1999
196.871 mln
+134.471 mln
215.5%
jan 1, 2000
207.688 mln
+10.818 mln
5.49%
jan 1, 2001
407.485 mln
+199.796 mln
96.2%
jan 1, 2002
612.69 mln
+205.206 mln
50.36%
jan 1, 2003
635.333 mln
+22.643 mln
3.7%
jan 1, 2004
114.451 mln
-520.882 mln
-81.99%
jan 1, 2005
195.762 mln
+81.311 mln
71.04%
jan 1, 2006
116.85 mln
-78.912 mln
-40.31%
jan 1, 2007
154.158 mln
+37.308 mln
31.93%
jan 1, 2008
213.13 mln
+58.972 mln
38.25%
jan 1, 2009
242.3 mln
+29.17 mln
13.69%
jan 1, 2010
268.17 mln
+25.871 mln
10.68%
jan 1, 2011
348.861 mln
+80.691 mln
30.09%
jan 1, 2012
405.154 mln
+56.293 mln
16.14%
jan 1, 2013
914.085 mln
+508.931 mln
125.61%
jan 1, 2014
358.374 mln
-555.711 mln
-60.79%
jan 1, 2015
355.103 mln
-3.27 mln
-0.91%
jan 1, 2016
370.332 mln
+15.229 mln
4.29%
Ranking of countries by current statistics by years


Comments: