29
/
en
AIzaSyAYiBZKx7MnpbEhh9jyipgxe19OcubqV5w
April 1, 2024
107749
Colombia
COL
true
2
1
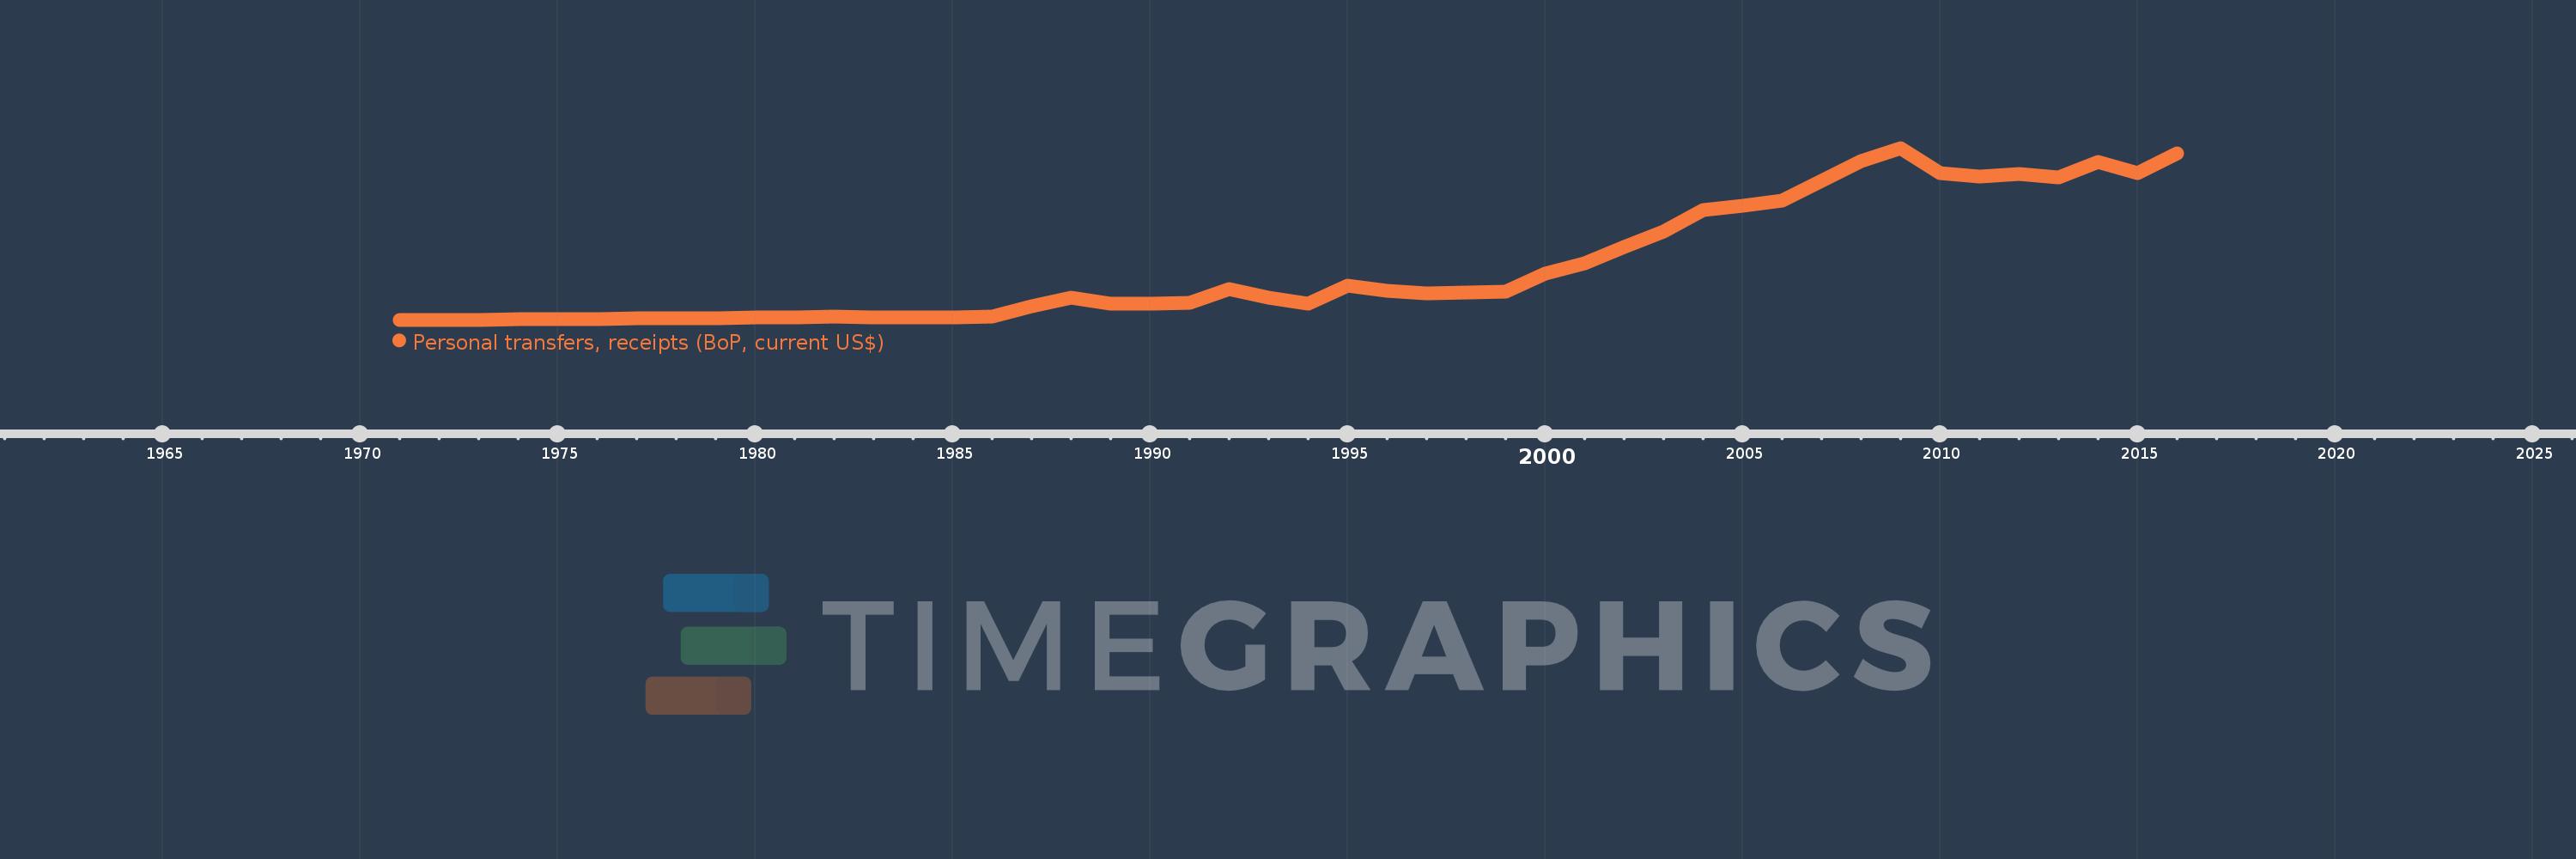
Personal transfers, receipts (BoP, current US$)
2016,2015,2014,2013,2012,2011,2010,2009,2008,2007,2006,2005,2004,2003,2002,2001,2000,1999,1998,1997,1996,1995,1994,1993,1992,1991,1990,1989,1988,1987,1986,1985,1984,1983,1982,1981,1980,1979,1978,1977,1976,1975,1974,1973,1972,1971
This statistics in other country:
Timeline:
This timeline shows a graph from 1971 to 2016 of Colombia. No data until 1970. Number of actual observations by date: 46.
Source name:
World Development Indicators
Source organization:
International Monetary Fund, Balance of Payments Statistics Yearbook and data files.
Categories, topics:
Economy & Growth, Financial Sector
Last updated:
apr 23, 2017
Indicators value changes by year
Minimum:
6.0 mln
jan 1, 1971
Maximum:
4.785 bln
jan 1, 2009
At the date of observation
Value
Absolute change
Change from previous value
jan 1, 1971
6.0 mln
+6.0 mln
0.0%
jan 1, 1972
8.024 mln
+2.024 mln
33.73%
jan 1, 1973
8.686 mln
+661.84K
8.25%
jan 1, 1974
11.921 mln
+3.236 mln
37.25%
jan 1, 1975
15.634 mln
+3.713 mln
31.15%
jan 1, 1976
18.0 mln
+2.366 mln
15.13%
jan 1, 1977
42.0 mln
+24.0 mln
133.33%
jan 1, 1978
42.031 mln
+30.72K
0.07%
jan 1, 1979
43.82 mln
+1.789 mln
4.26%
jan 1, 1980
63.0 mln
+19.18 mln
43.77%
jan 1, 1981
68.0 mln
+5.0 mln
7.94%
jan 1, 1982
99.0 mln
+31.0 mln
45.59%
jan 1, 1983
71.0 mln
-28.0 mln
-28.28%
jan 1, 1984
63.0 mln
-8.0 mln
-11.27%
jan 1, 1985
71.0 mln
+8.0 mln
12.7%
jan 1, 1986
105.0 mln
+34.0 mln
47.89%
jan 1, 1987
393.0 mln
+288.0 mln
274.29%
jan 1, 1988
616.0 mln
+223.0 mln
56.74%
jan 1, 1989
448.0 mln
-168.0 mln
-27.27%
jan 1, 1990
459.0 mln
+11.0 mln
2.46%
jan 1, 1991
488.0 mln
+29.0 mln
6.32%
jan 1, 1992
866.0 mln
+378.0 mln
77.46%
jan 1, 1993
630.0 mln
-236.0 mln
-27.25%
jan 1, 1994
454.6 mln
-175.4 mln
-27.84%
jan 1, 1995
965.5 mln
+510.9 mln
112.38%
jan 1, 1996
809.25 mln
-156.25 mln
-16.18%
jan 1, 1997
745.3 mln
-63.95 mln
-7.9%
jan 1, 1998
757.7 mln
+12.4 mln
1.66%
jan 1, 1999
788.39 mln
+30.69 mln
4.05%
jan 1, 2000
1.297 bln
+508.976 mln
64.56%
jan 1, 2001
1.578 bln
+280.662 mln
21.63%
jan 1, 2002
2.021 bln
+443.363 mln
28.1%
jan 1, 2003
2.454 bln
+432.319 mln
21.39%
jan 1, 2004
3.06 bln
+606.385 mln
24.71%
jan 1, 2005
3.17 bln
+109.804 mln
3.59%
jan 1, 2006
3.314 bln
+143.816 mln
4.54%
jan 1, 2007
3.861 bln
+547.228 mln
16.51%
jan 1, 2008
4.43 bln
+568.794 mln
14.73%
jan 1, 2009
4.785 bln
+355.177 mln
8.02%
jan 1, 2010
4.09 bln
-694.635 mln
-14.52%
jan 1, 2011
3.996 bln
-93.931 mln
-2.3%
jan 1, 2012
4.064 bln
+67.747 mln
1.7%
jan 1, 2013
3.97 bln
-94.437 mln
-2.32%
jan 1, 2014
4.401 bln
+431.385 mln
10.87%
jan 1, 2015
4.093 bln
-307.837 mln
-6.99%
jan 1, 2016
4.636 bln
+542.33 mln
13.25%
Ranking of countries by current statistics by years


Comments: