29
/
en
AIzaSyAYiBZKx7MnpbEhh9jyipgxe19OcubqV5w
April 1, 2024
51284
Middle income
MIC
false
2
1
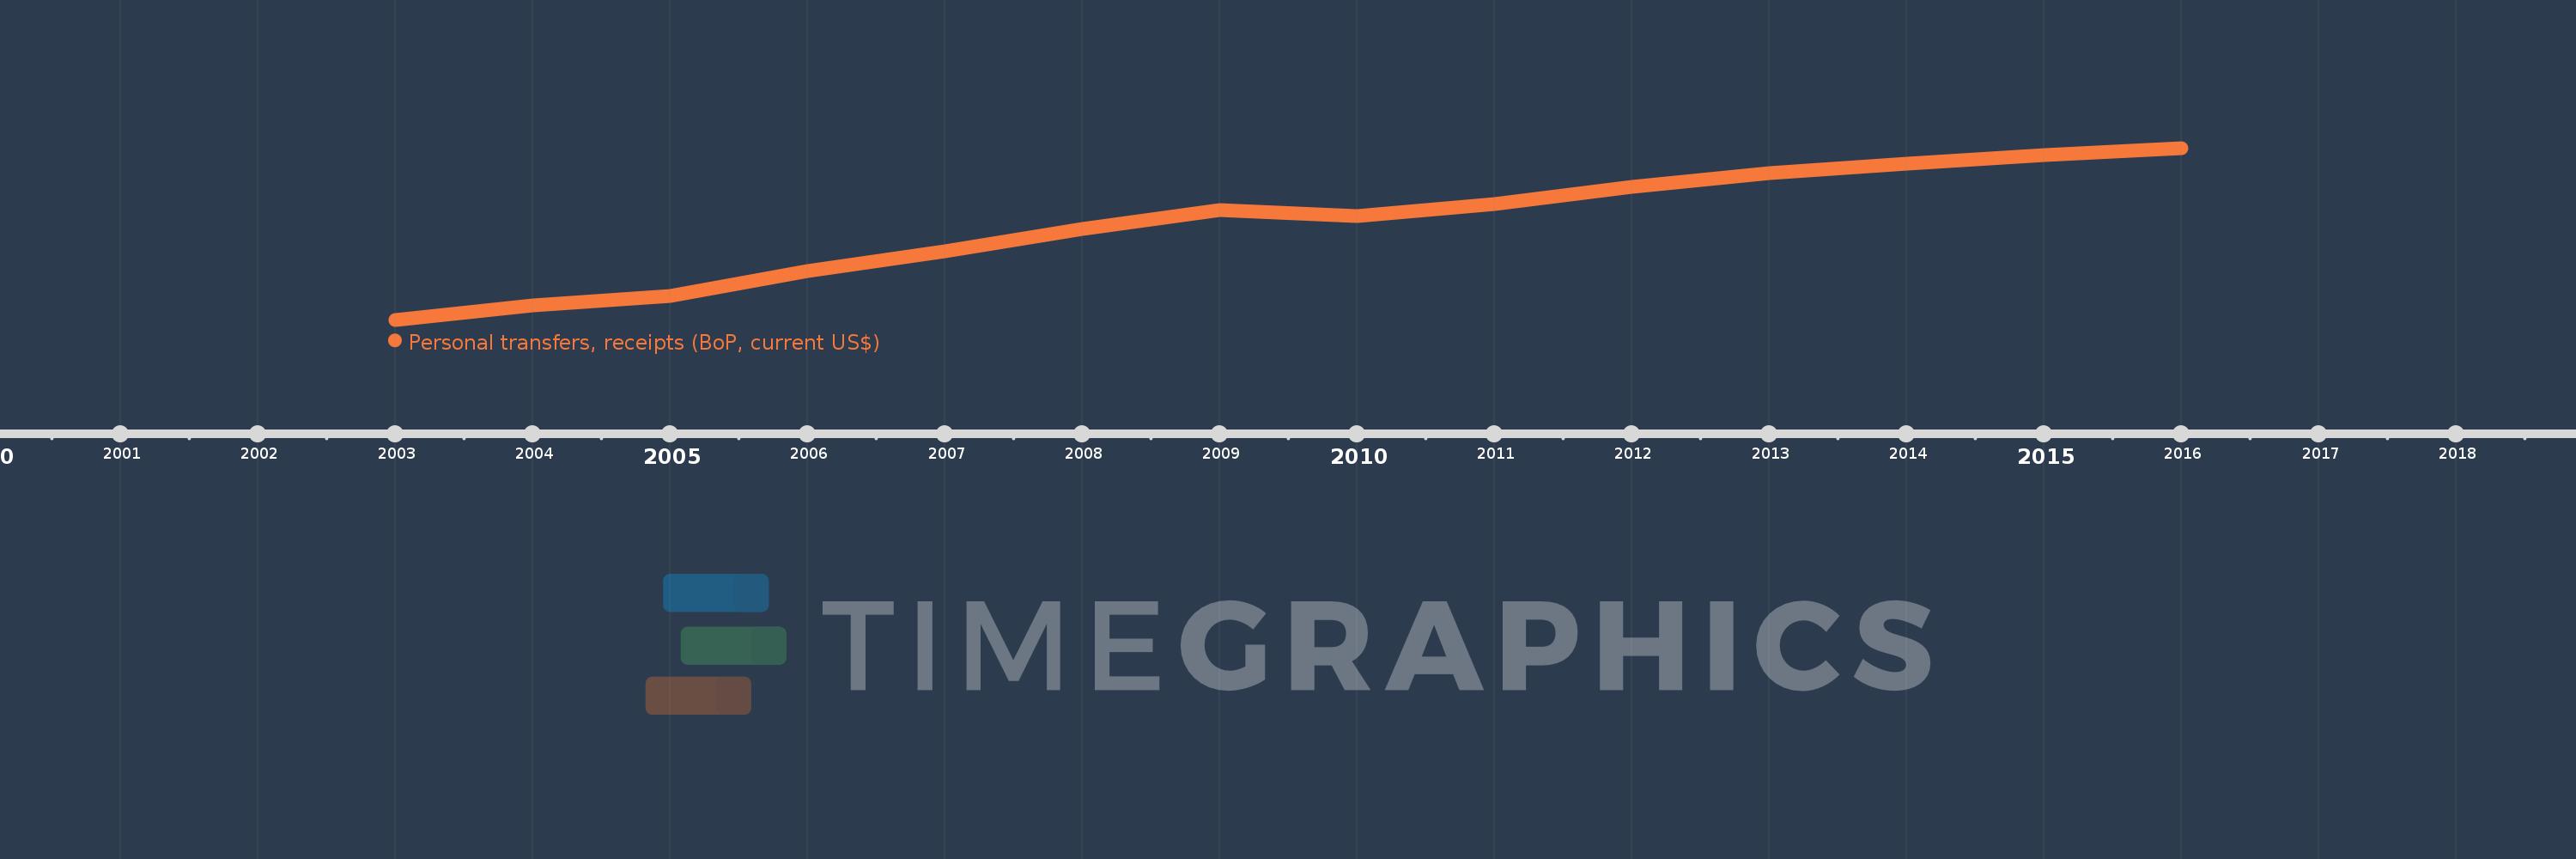
Personal transfers, receipts (BoP, current US$)
2016,2015,2014,2013,2012,2011,2010,2009,2008,2007,2006,2005,2004,2003
This statistics in other country:
Timeline:
This timeline shows a graph from 2003 to 2016 of Middle income. No data until 2002. Number of actual observations by date: 14.
Source name:
World Development Indicators
Source organization:
International Monetary Fund, Balance of Payments Statistics Yearbook and data files.
Categories, topics:
Economy & Growth, Financial Sector
Last updated:
apr 23, 2017
Indicators value changes by year
Minimum:
77.985 bln
jan 1, 2003
Maximum:
308.539 bln
jan 1, 2016
At the date of observation
Value
Absolute change
Change from previous value
jan 1, 2003
77.985 bln
+77.985 bln
0.0%
jan 1, 2004
97.146 bln
+19.161 bln
24.57%
jan 1, 2005
110.351 bln
+13.205 bln
13.59%
jan 1, 2006
143.376 bln
+33.025 bln
29.93%
jan 1, 2007
169.385 bln
+26.008 bln
18.14%
jan 1, 2008
199.488 bln
+30.104 bln
17.77%
jan 1, 2009
225.577 bln
+26.089 bln
13.08%
jan 1, 2010
217.072 bln
-8.505 bln
-3.77%
jan 1, 2011
232.888 bln
+15.816 bln
7.29%
jan 1, 2012
256.616 bln
+23.728 bln
10.19%
jan 1, 2013
275.248 bln
+18.632 bln
7.26%
jan 1, 2014
287.025 bln
+11.777 bln
4.28%
jan 1, 2015
298.797 bln
+11.772 bln
4.1%
jan 1, 2016
308.539 bln
+9.742 bln
3.26%
Ranking of countries by current statistics by years


Comments: