29
/
en
AIzaSyAYiBZKx7MnpbEhh9jyipgxe19OcubqV5w
April 1, 2024
142195
Greece
GRC
true
2
1
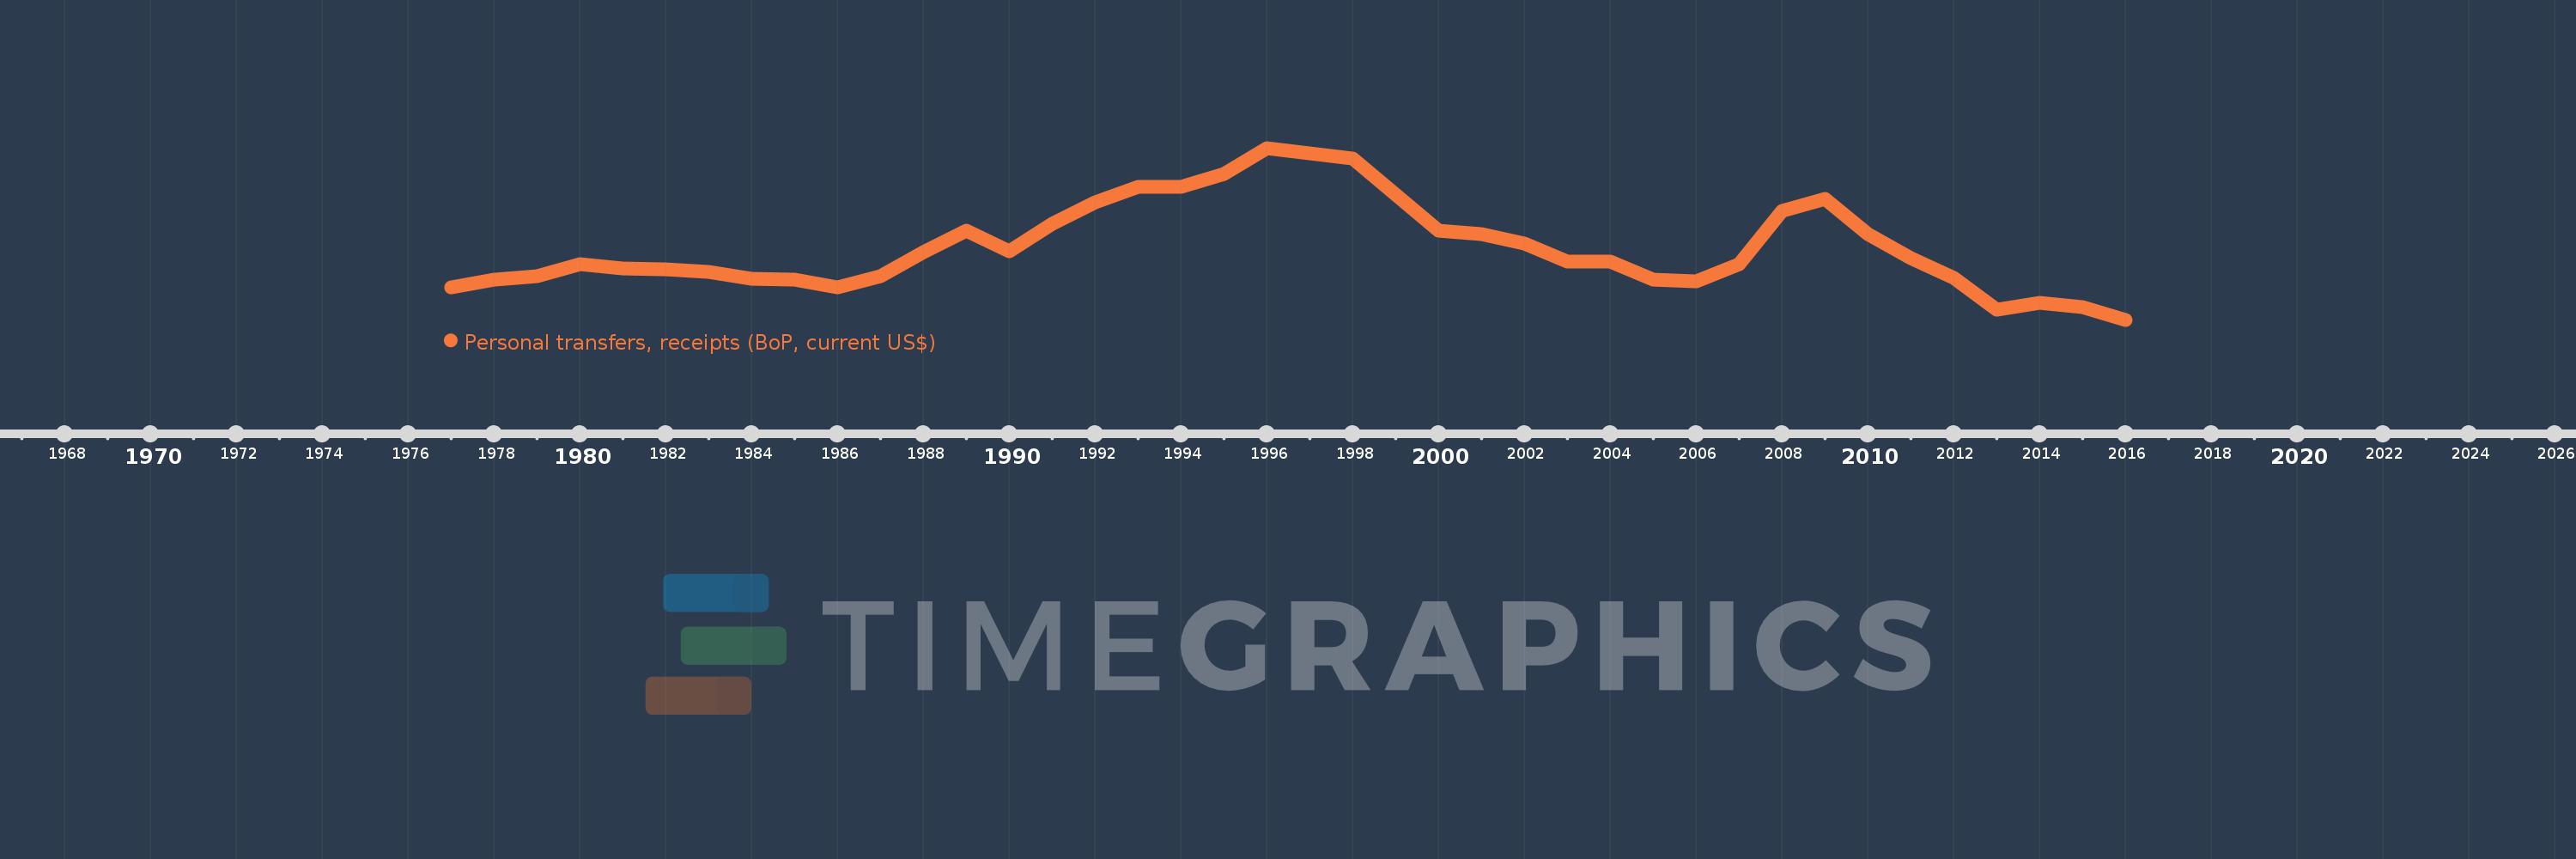
Personal transfers, receipts (BoP, current US$)
2016,2015,2014,2013,2012,2011,2010,2009,2008,2007,2006,2005,2004,2003,2002,2001,2000,1998,1997,1996,1995,1994,1993,1992,1991,1990,1989,1988,1987,1986,1985,1984,1983,1982,1981,1980,1979,1978,1977
This statistics in other country:
Timeline:
This timeline shows a graph from 1977 to 2016 of Greece. No data until 1976. Number of actual observations by date: 39.
Source name:
World Development Indicators
Source organization:
International Monetary Fund, Balance of Payments Statistics Yearbook and data files.
Categories, topics:
Economy & Growth, Financial Sector
Last updated:
apr 23, 2017
Indicators value changes by year
Minimum:
258.051 mln
jan 1, 2016
Maximum:
2.982 bln
jan 1, 1996
At the date of observation
Value
Absolute change
Change from previous value
jan 1, 1977
777.0 mln
+777.0 mln
0.0%
jan 1, 1978
900.0 mln
+123.0 mln
15.83%
jan 1, 1979
952.0 mln
+52.0 mln
5.78%
jan 1, 1980
1.137 bln
+185.0 mln
19.43%
jan 1, 1981
1.066 bln
-71.0 mln
-6.24%
jan 1, 1982
1.057 bln
-9.0 mln
-0.84%
jan 1, 1983
1.016 bln
-41.0 mln
-3.88%
jan 1, 1984
912.0 mln
-104.0 mln
-10.24%
jan 1, 1985
898.0 mln
-14.0 mln
-1.54%
jan 1, 1986
775.0 mln
-123.0 mln
-13.7%
jan 1, 1987
942.0 mln
+167.0 mln
21.55%
jan 1, 1988
1.334 bln
+392.0 mln
41.61%
jan 1, 1989
1.675 bln
+341.0 mln
25.56%
jan 1, 1990
1.35 bln
-325.0 mln
-19.4%
jan 1, 1991
1.775 bln
+425.0 mln
31.48%
jan 1, 1992
2.115 bln
+340.0 mln
19.15%
jan 1, 1993
2.366 bln
+251.0 mln
11.87%
jan 1, 1994
2.36 bln
-6.0 mln
-0.25%
jan 1, 1995
2.576 bln
+216.0 mln
9.15%
jan 1, 1996
2.982 bln
+406.0 mln
15.76%
jan 1, 1997
2.894 bln
-88.0 mln
-2.95%
jan 1, 1998
2.816 bln
-78.0 mln
-2.7%
jan 1, 2000
1.667 bln
-1.149 bln
-40.79%
jan 1, 2001
1.613 bln
-54.3 mln
-3.26%
jan 1, 2002
1.471 bln
-142.1 mln
-8.81%
jan 1, 2003
1.181 bln
-289.928 mln
-19.71%
jan 1, 2004
1.183 bln
+1.783 mln
0.15%
jan 1, 2005
894.329 mln
-288.527 mln
-24.39%
jan 1, 2006
863.454 mln
-30.875 mln
-3.45%
jan 1, 2007
1.143 bln
+279.185 mln
32.33%
jan 1, 2008
1.98 bln
+837.136 mln
73.26%
jan 1, 2009
2.178 bln
+198.289 mln
10.02%
jan 1, 2010
1.609 bln
-568.833 mln
-26.12%
jan 1, 2011
1.234 bln
-374.873 mln
-23.3%
jan 1, 2012
924.71 mln
-309.647 mln
-25.09%
jan 1, 2013
423.071 mln
-501.639 mln
-54.25%
jan 1, 2014
526.692 mln
+103.62 mln
24.49%
jan 1, 2015
456.032 mln
-70.66 mln
-13.42%
jan 1, 2016
258.051 mln
-197.981 mln
-43.41%
Ranking of countries by current statistics by years


Comments: