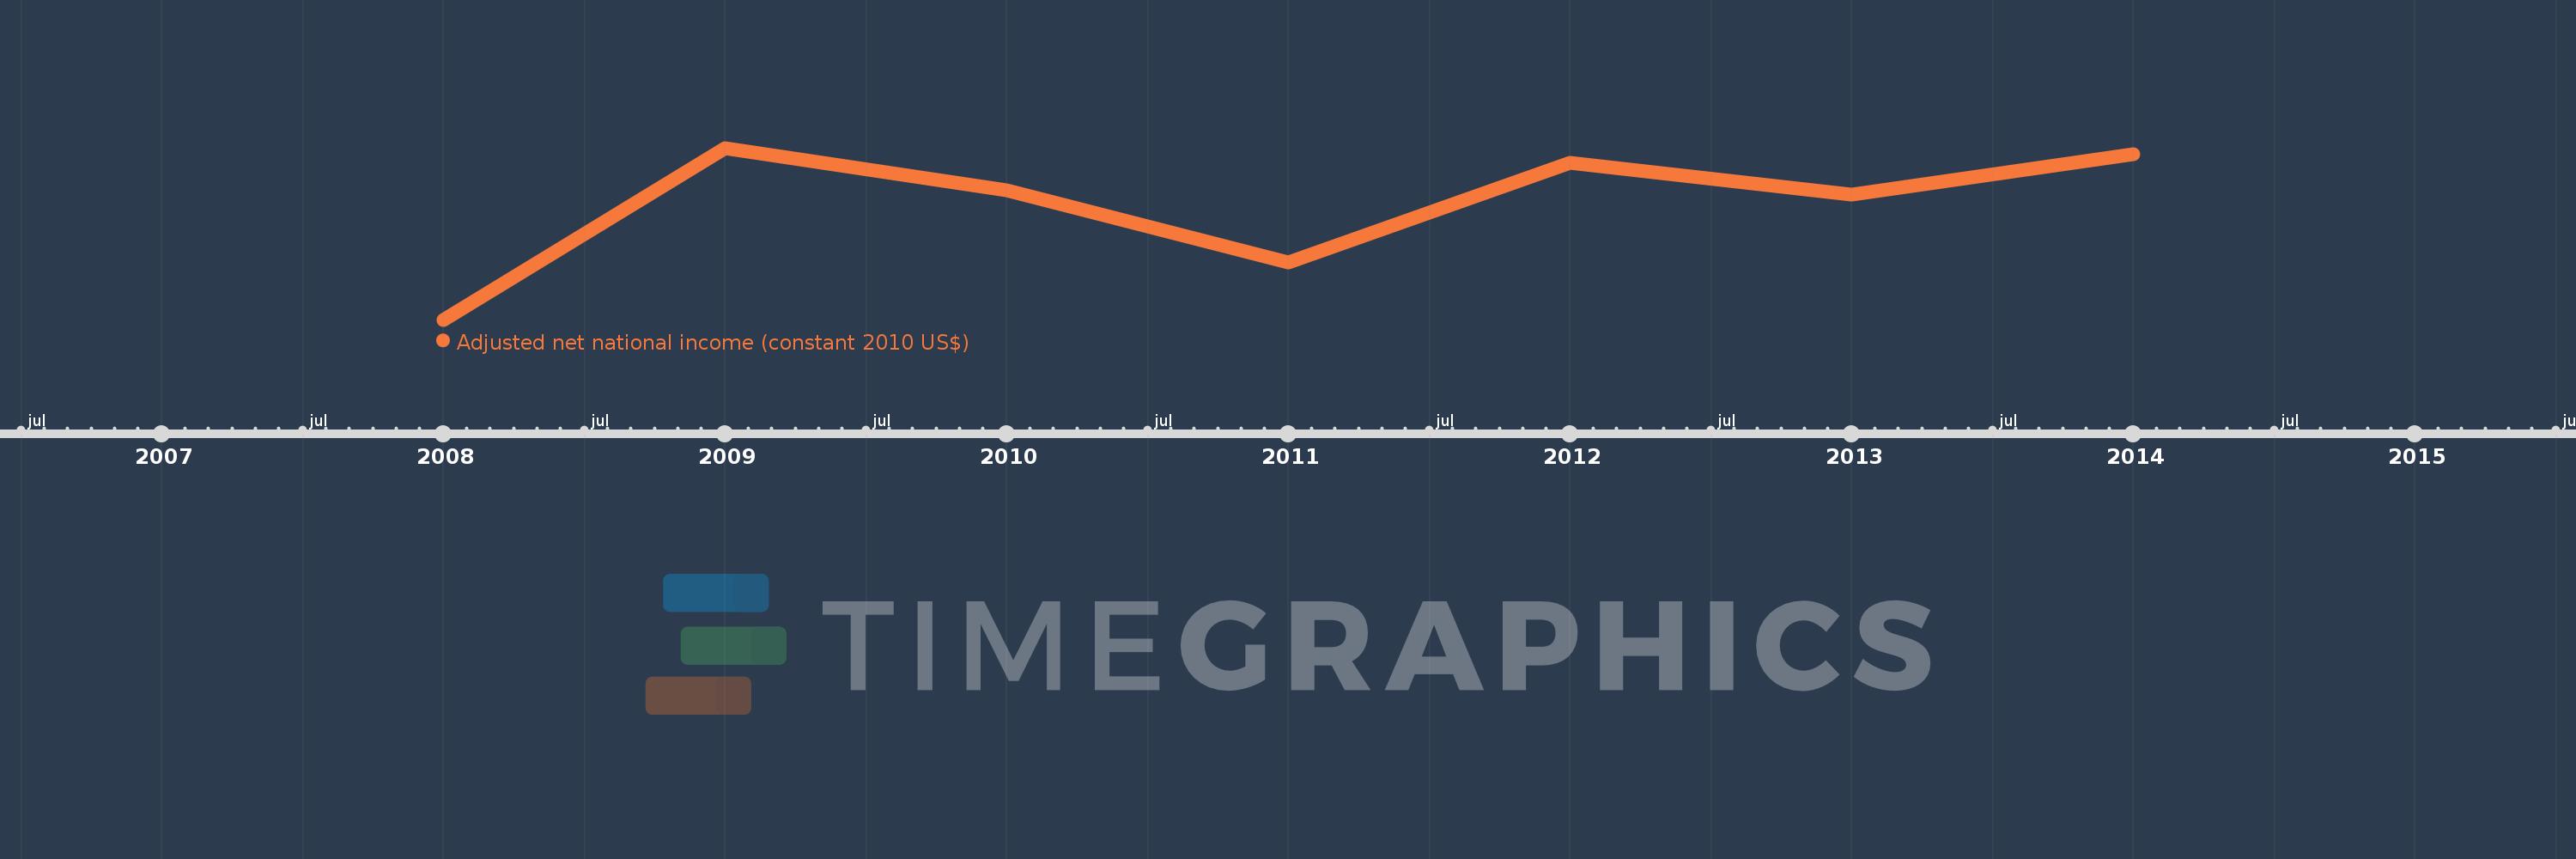
This timeline shows a graph from 2008 to 2014 of Cabo Verde. No data until 2007. Number of actual observations by date: 7.
Source name:
World Development Indicators
Source organization:
World Bank staff estimates based on sources and methods in World Bank's "The Changing Wealth of Nations: Measuring Sustainable Development in the New Millennium" (2011).
Categories, topics:
Economy & Growth
Last updated:
apr 23, 2017
Indicators value changes by year
Meaning:
1.308 bln
Minimum:
1.271 bln
jan 1, 2008
Maximum:
1.326 bln
jan 1, 2009
At the date of observation
Value
Absolute change
Change from the previous value
jan 1, 2008
1.271 bln
+1.271 bln
0.0%
jan 1, 2009
1.326 bln
+54.882 mln
4.32%
jan 1, 2010
1.313 bln
-13.414 mln
-1.01%
jan 1, 2011
1.289 bln
-23.102 mln
-1.76%
jan 1, 2012
1.321 bln
+31.884 mln
2.47%
jan 1, 2013
1.311 bln
-10.238 mln
-0.77%
jan 1, 2014
1.324 bln
+12.925 mln
0.99%
Ranking of countries by current statistics by years