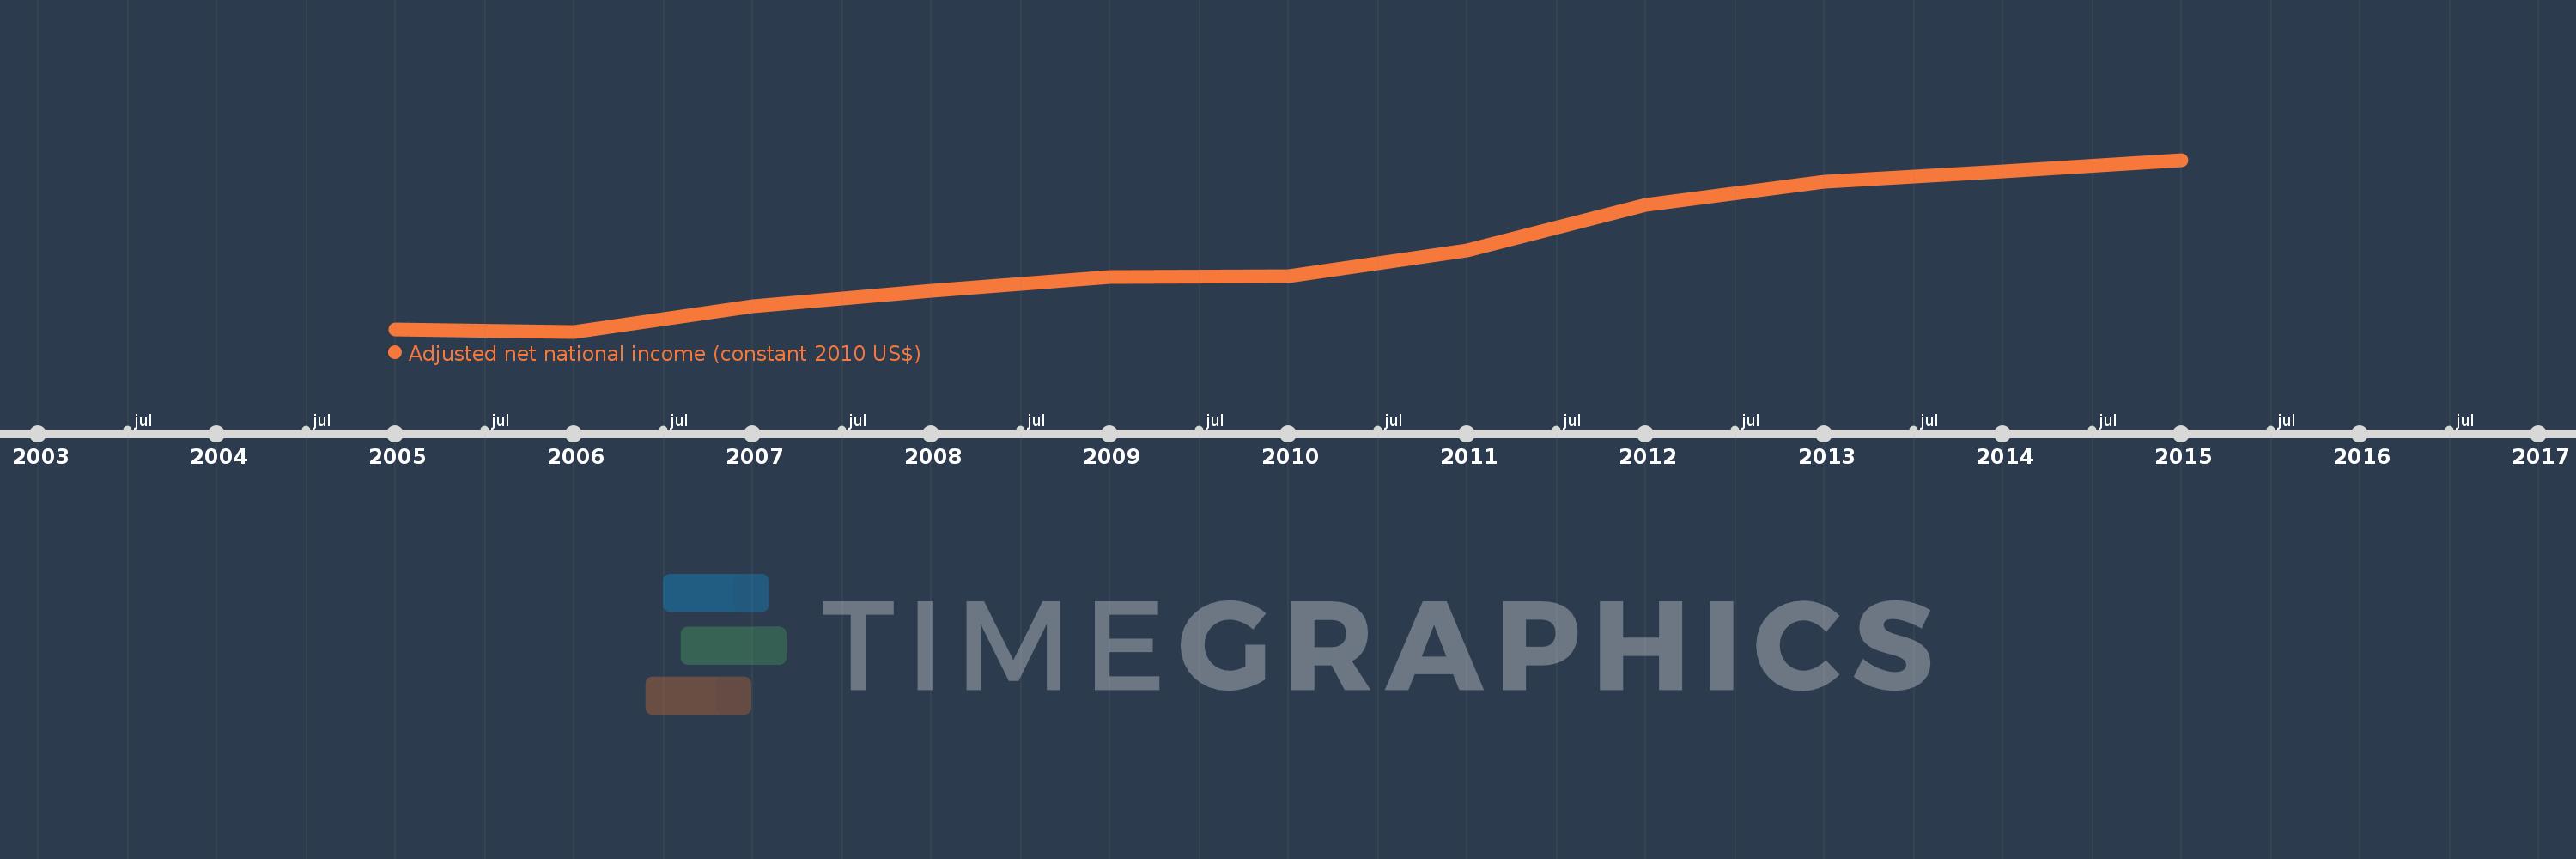
This timeline shows a graph from 2005 to 2015 of Qatar. No data until 2004. Number of actual observations by date: 11.
Source name:
World Development Indicators
Source organization:
World Bank staff estimates based on sources and methods in World Bank's "The Changing Wealth of Nations: Measuring Sustainable Development in the New Millennium" (2011).
Categories, topics:
Economy & Growth
Last updated:
apr 23, 2017
Indicators value changes by year
Meaning:
66.125 bln
Minimum:
22.923 bln
jan 1, 2006
Maximum:
116.964 bln
jan 1, 2015
At the date of observation
Value
Absolute change
Change from the previous value
jan 1, 2005
24.045 bln
+24.045 bln
0.0%
jan 1, 2006
22.923 bln
-1.122 bln
-4.67%
jan 1, 2007
36.681 bln
+13.758 bln
60.02%
jan 1, 2008
45.301 bln
+8.62 bln
23.5%
jan 1, 2009
52.971 bln
+7.67 bln
16.93%
jan 1, 2010
53.398 bln
+427.401 mln
0.81%
jan 1, 2011
67.493 bln
+14.095 bln
26.4%
jan 1, 2012
92.179 bln
+24.685 bln
36.57%
jan 1, 2013
104.803 bln
+12.625 bln
13.7%
jan 1, 2014
110.616 bln
+5.812 bln
5.55%
jan 1, 2015
116.964 bln
+6.348 bln
5.74%
Ranking of countries by current statistics by years