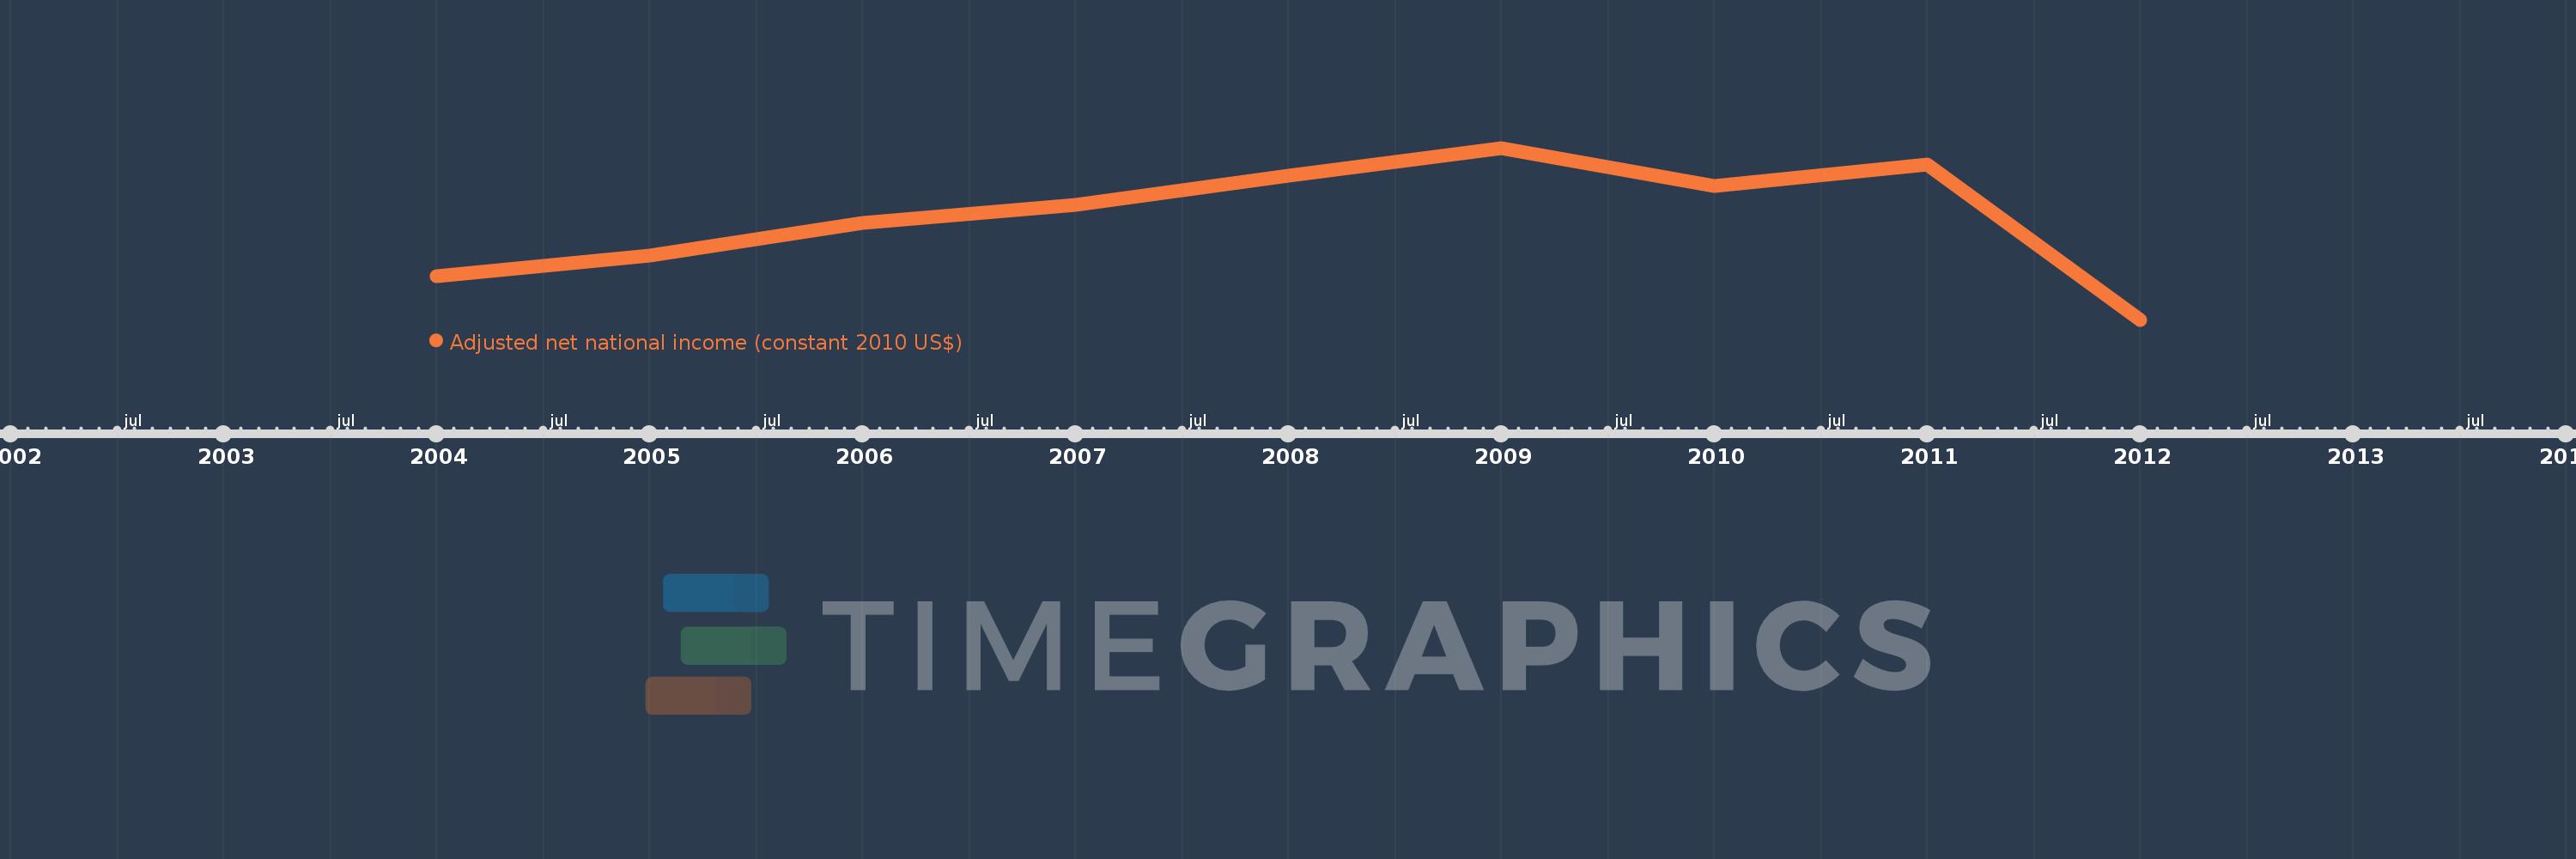
This timeline shows a graph from 2004 to 2012 of Libya. No data until 2003. Number of actual observations by date: 9.
Source name:
World Development Indicators
Source organization:
World Bank staff estimates based on sources and methods in World Bank's "The Changing Wealth of Nations: Measuring Sustainable Development in the New Millennium" (2011).
Categories, topics:
Economy & Growth
Last updated:
apr 23, 2017
Indicators value changes by year
Meaning:
38.427 bln
Minimum:
19.447 bln
jan 1, 2012
Maximum:
51.161 bln
jan 1, 2009
At the date of observation
Value
Absolute change
Change from the previous value
jan 1, 2004
27.434 bln
+27.434 bln
0.0%
jan 1, 2005
31.337 bln
+3.902 bln
14.22%
jan 1, 2006
37.353 bln
+6.017 bln
19.2%
jan 1, 2007
40.666 bln
+3.313 bln
8.87%
jan 1, 2008
46.116 bln
+5.449 bln
13.4%
jan 1, 2009
51.161 bln
+5.045 bln
10.94%
jan 1, 2010
44.185 bln
-6.975 bln
-13.63%
jan 1, 2011
48.14 bln
+3.954 bln
8.95%
jan 1, 2012
19.447 bln
-28.692 bln
-59.6%
Ranking of countries by current statistics by years