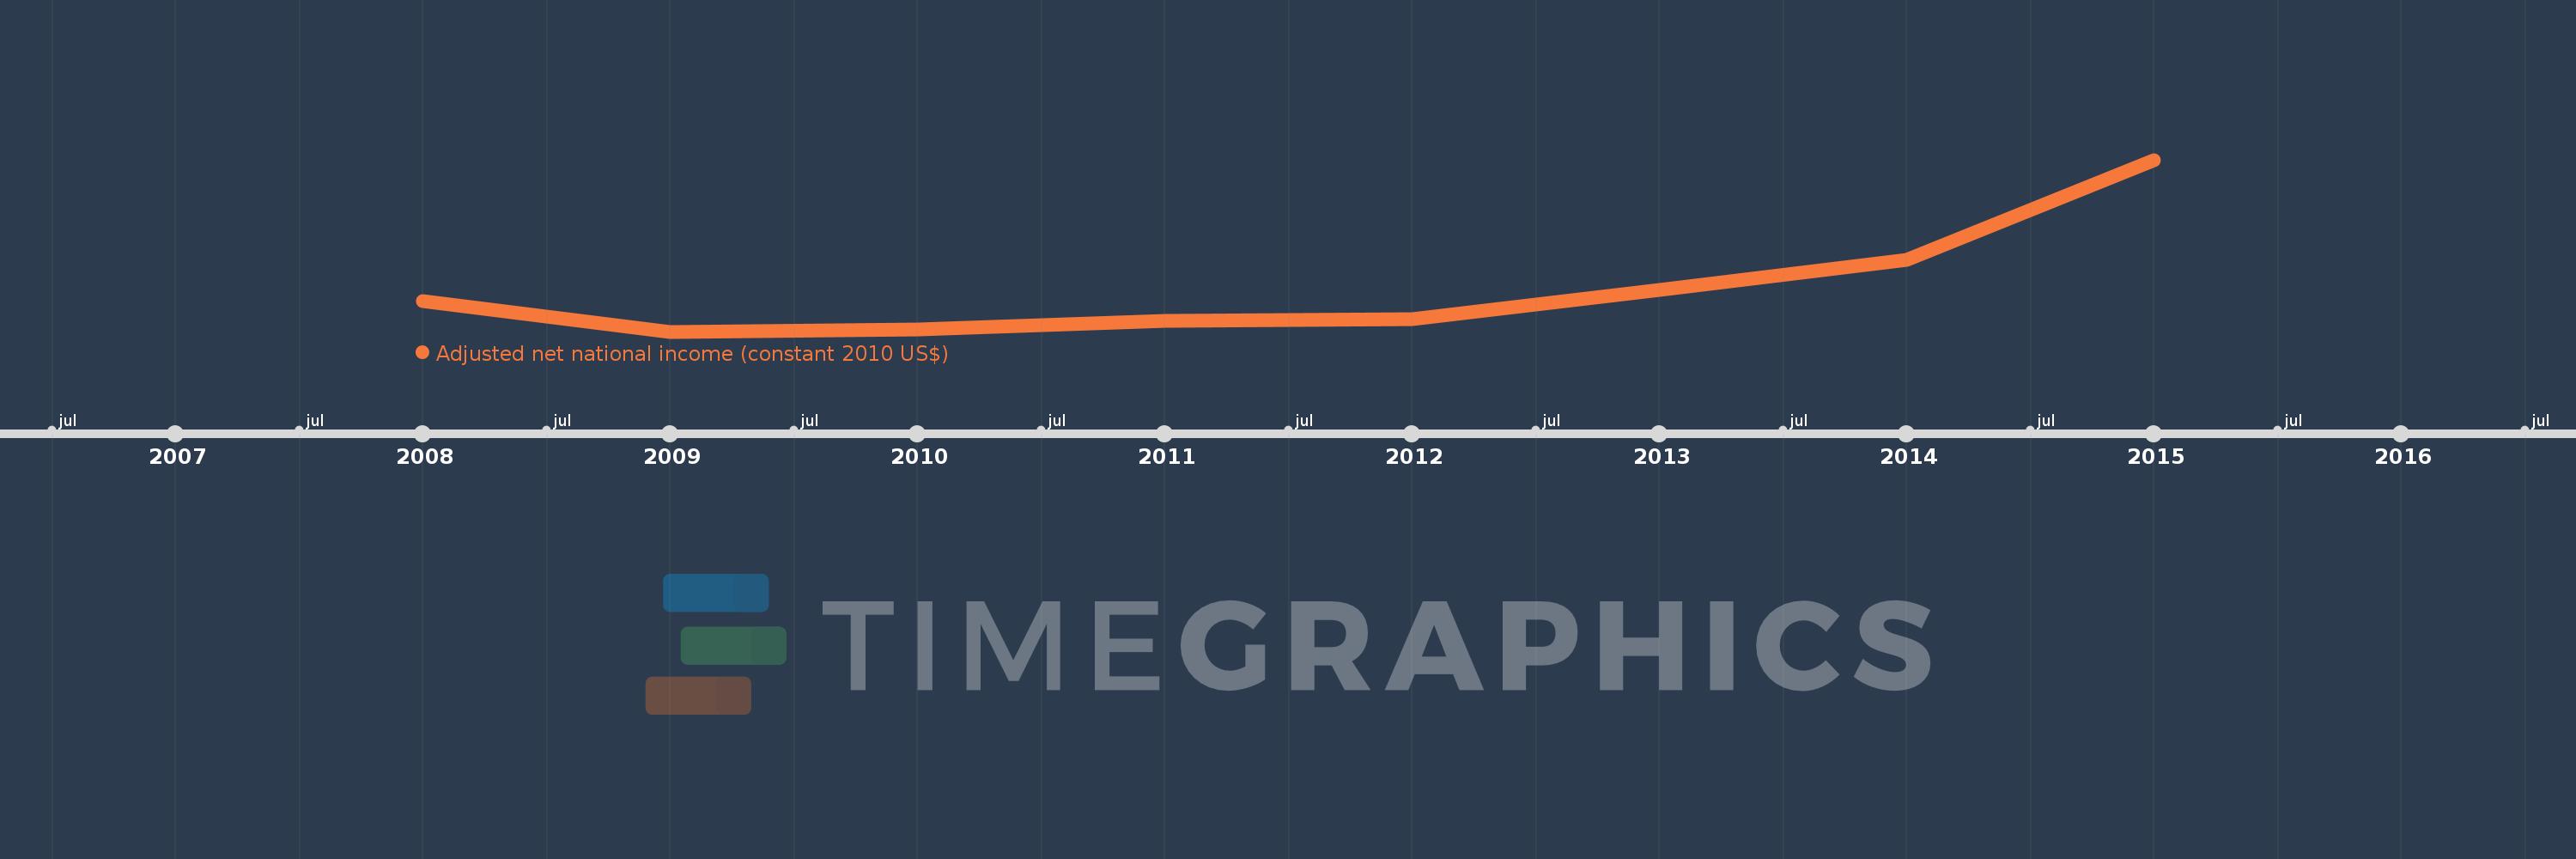
This timeline shows a graph from 2008 to 2015 of Caribbean small states. No data until 2007. Number of actual observations by date: 8.
Source name:
World Development Indicators
Source organization:
World Bank staff estimates based on sources and methods in World Bank's "The Changing Wealth of Nations: Measuring Sustainable Development in the New Millennium" (2011).
Categories, topics:
Economy & Growth
Last updated:
apr 23, 2017
Indicators value changes by year
Meaning:
47.436 bln
Minimum:
43.389 bln
jan 1, 2009
Maximum:
59.717 bln
jan 1, 2015
At the date of observation
Value
Absolute change
Change from the previous value
jan 1, 2008
46.324 bln
+46.324 bln
0.0%
jan 1, 2009
43.389 bln
-2.934 bln
-6.33%
jan 1, 2010
43.574 bln
+185.062 mln
0.43%
jan 1, 2011
44.41 bln
+835.142 mln
1.92%
jan 1, 2012
44.544 bln
+134.495 mln
0.3%
jan 1, 2013
47.332 bln
+2.788 bln
6.26%
jan 1, 2014
50.198 bln
+2.867 bln
6.06%
jan 1, 2015
59.717 bln
+9.518 bln
18.96%
Ranking of countries by current statistics by years