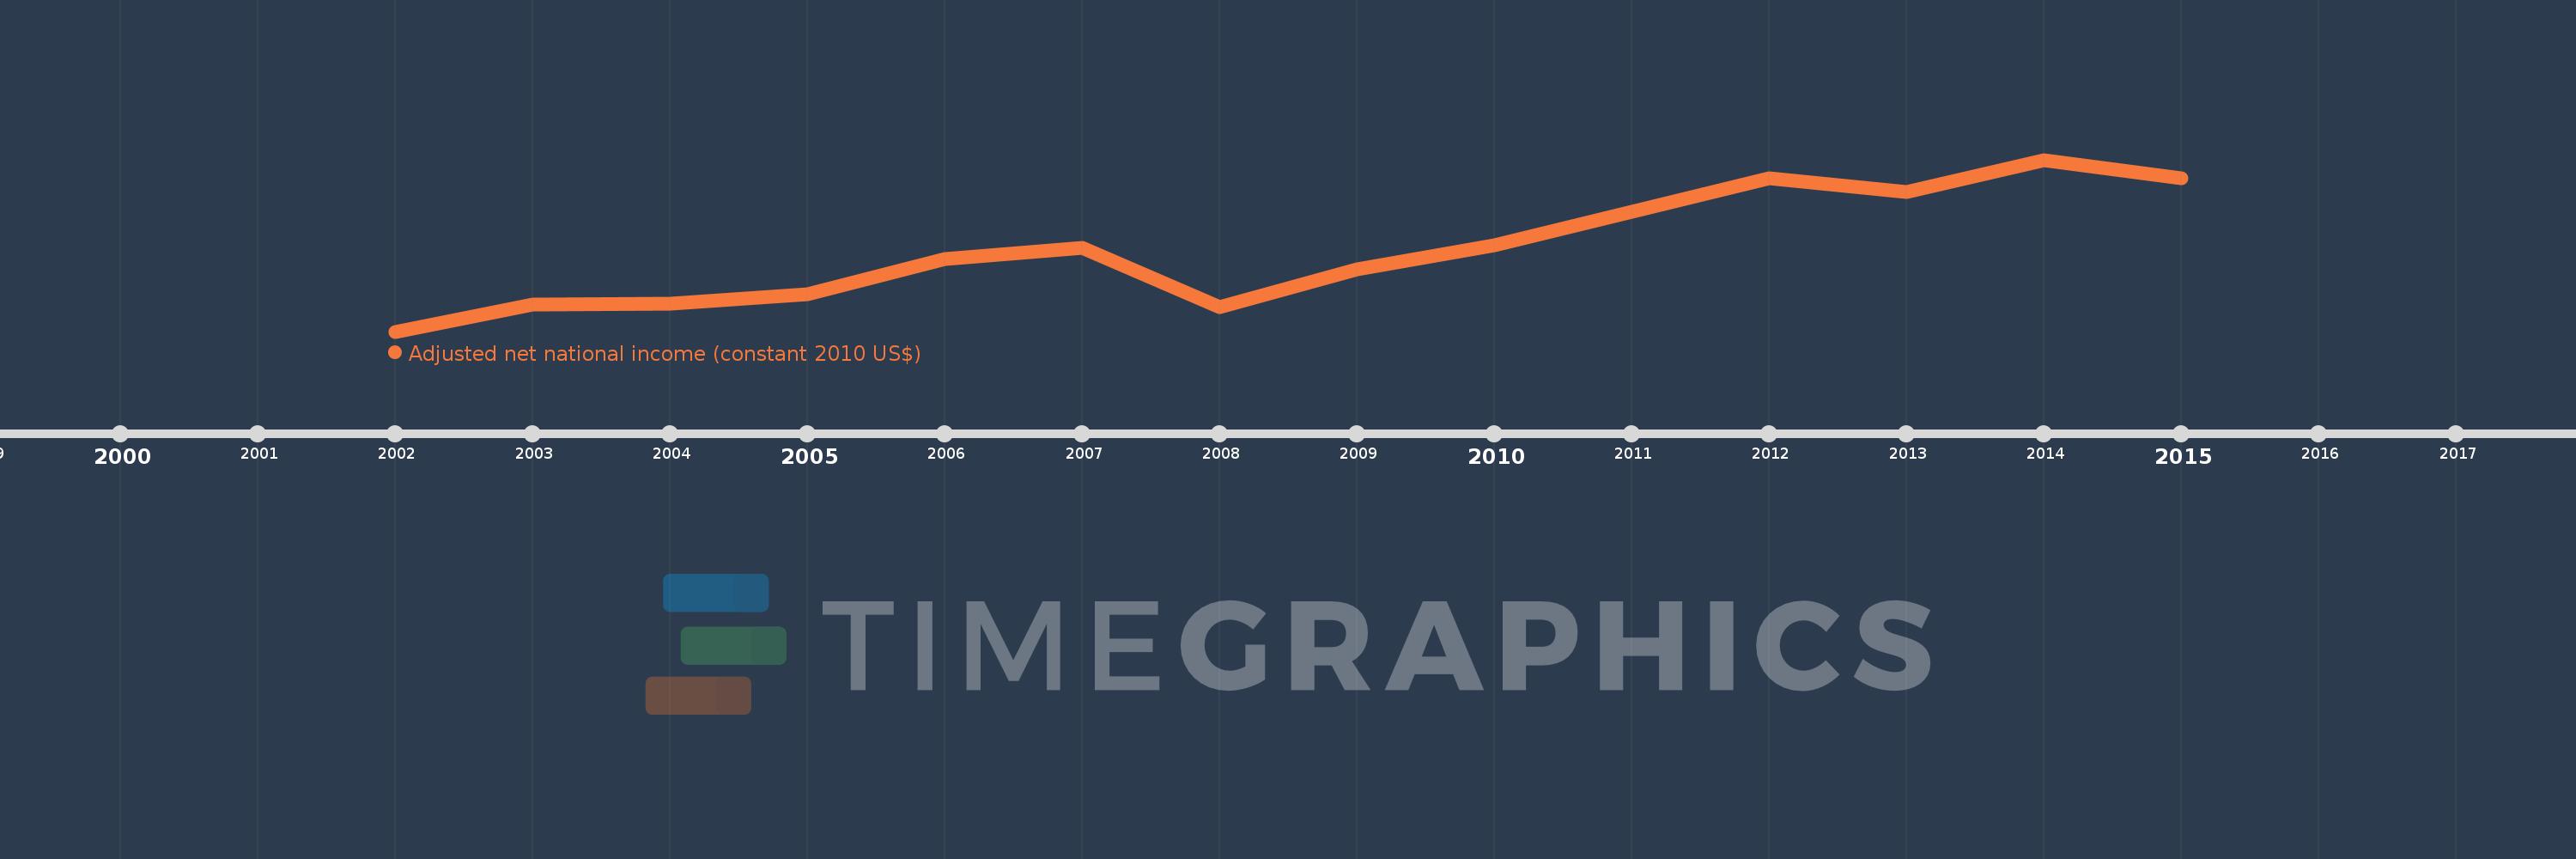
This timeline shows a graph from 2002 to 2015 of Comoros. No data until 2001. Number of actual observations by date: 14.
Source name:
World Development Indicators
Source organization:
World Bank staff estimates based on sources and methods in World Bank's "The Changing Wealth of Nations: Measuring Sustainable Development in the New Millennium" (2011).
Categories, topics:
Economy & Growth
Last updated:
apr 23, 2017
Indicators value changes by year
Meaning:
429.629 mln
Minimum:
400.75 mln
jan 1, 2002
Maximum:
460.718 mln
jan 1, 2014
At the date of observation
Value
Absolute change
Change from the previous value
jan 1, 2002
400.75 mln
+400.75 mln
0.0%
jan 1, 2003
410.091 mln
+9.342 mln
2.33%
jan 1, 2004
410.523 mln
+431.555K
0.11%
jan 1, 2005
413.875 mln
+3.353 mln
0.82%
jan 1, 2006
426.046 mln
+12.17 mln
2.94%
jan 1, 2007
429.861 mln
+3.815 mln
0.9%
jan 1, 2008
409.284 mln
-20.577 mln
-4.79%
jan 1, 2009
422.392 mln
+13.108 mln
3.2%
jan 1, 2010
430.849 mln
+8.458 mln
2.0%
jan 1, 2011
442.458 mln
+11.609 mln
2.69%
jan 1, 2012
454.258 mln
+11.8 mln
2.67%
jan 1, 2013
449.468 mln
-4.79 mln
-1.05%
jan 1, 2014
460.718 mln
+11.25 mln
2.5%
jan 1, 2015
454.232 mln
-6.486 mln
-1.41%
Ranking of countries by current statistics by years