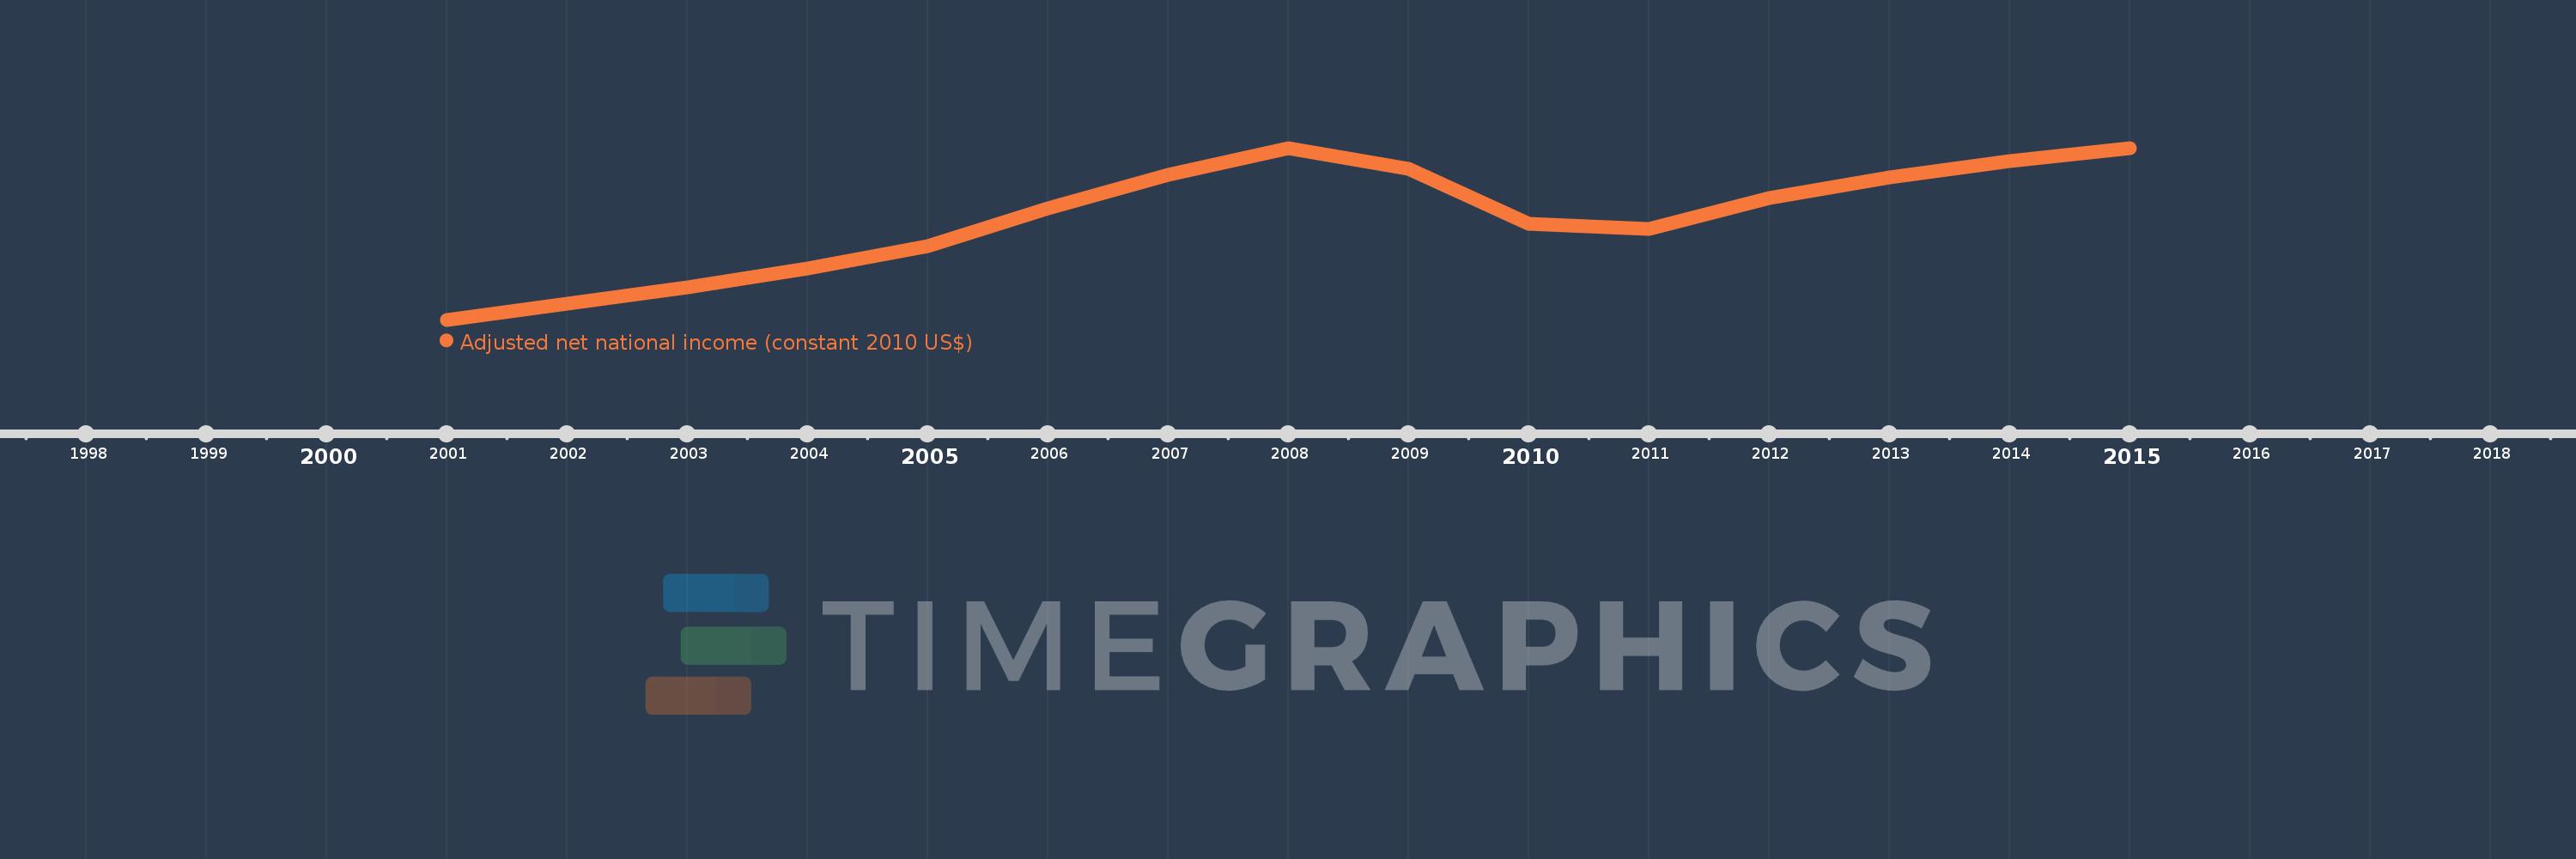
This timeline shows a graph from 2001 to 2015 of Estonia. No data until 2000. Number of actual observations by date: 15.
Source name:
World Development Indicators
Source organization:
World Bank staff estimates based on sources and methods in World Bank's "The Changing Wealth of Nations: Measuring Sustainable Development in the New Millennium" (2011).
Categories, topics:
Economy & Growth
Last updated:
apr 23, 2017
Indicators value changes by year
Meaning:
15.714 bln
Minimum:
10.691 bln
jan 1, 2001
Maximum:
19.132 bln
jan 1, 2015
At the date of observation
Value
Absolute change
Change from the previous value
jan 1, 2001
10.691 bln
+10.691 bln
0.0%
jan 1, 2002
11.473 bln
+781.876 mln
7.31%
jan 1, 2003
12.297 bln
+823.725 mln
7.18%
jan 1, 2004
13.204 bln
+907.222 mln
7.38%
jan 1, 2005
14.298 bln
+1.094 bln
8.29%
jan 1, 2006
16.184 bln
+1.886 bln
13.19%
jan 1, 2007
17.813 bln
+1.629 bln
10.07%
jan 1, 2008
19.103 bln
+1.29 bln
7.24%
jan 1, 2009
18.089 bln
-1.014 bln
-5.31%
jan 1, 2010
15.395 bln
-2.694 bln
-14.89%
jan 1, 2011
15.158 bln
-237.084 mln
-1.54%
jan 1, 2012
16.68 bln
+1.523 bln
10.04%
jan 1, 2013
17.703 bln
+1.023 bln
6.13%
jan 1, 2014
18.493 bln
+789.4 mln
4.46%
jan 1, 2015
19.132 bln
+638.901 mln
3.45%
Ranking of countries by current statistics by years