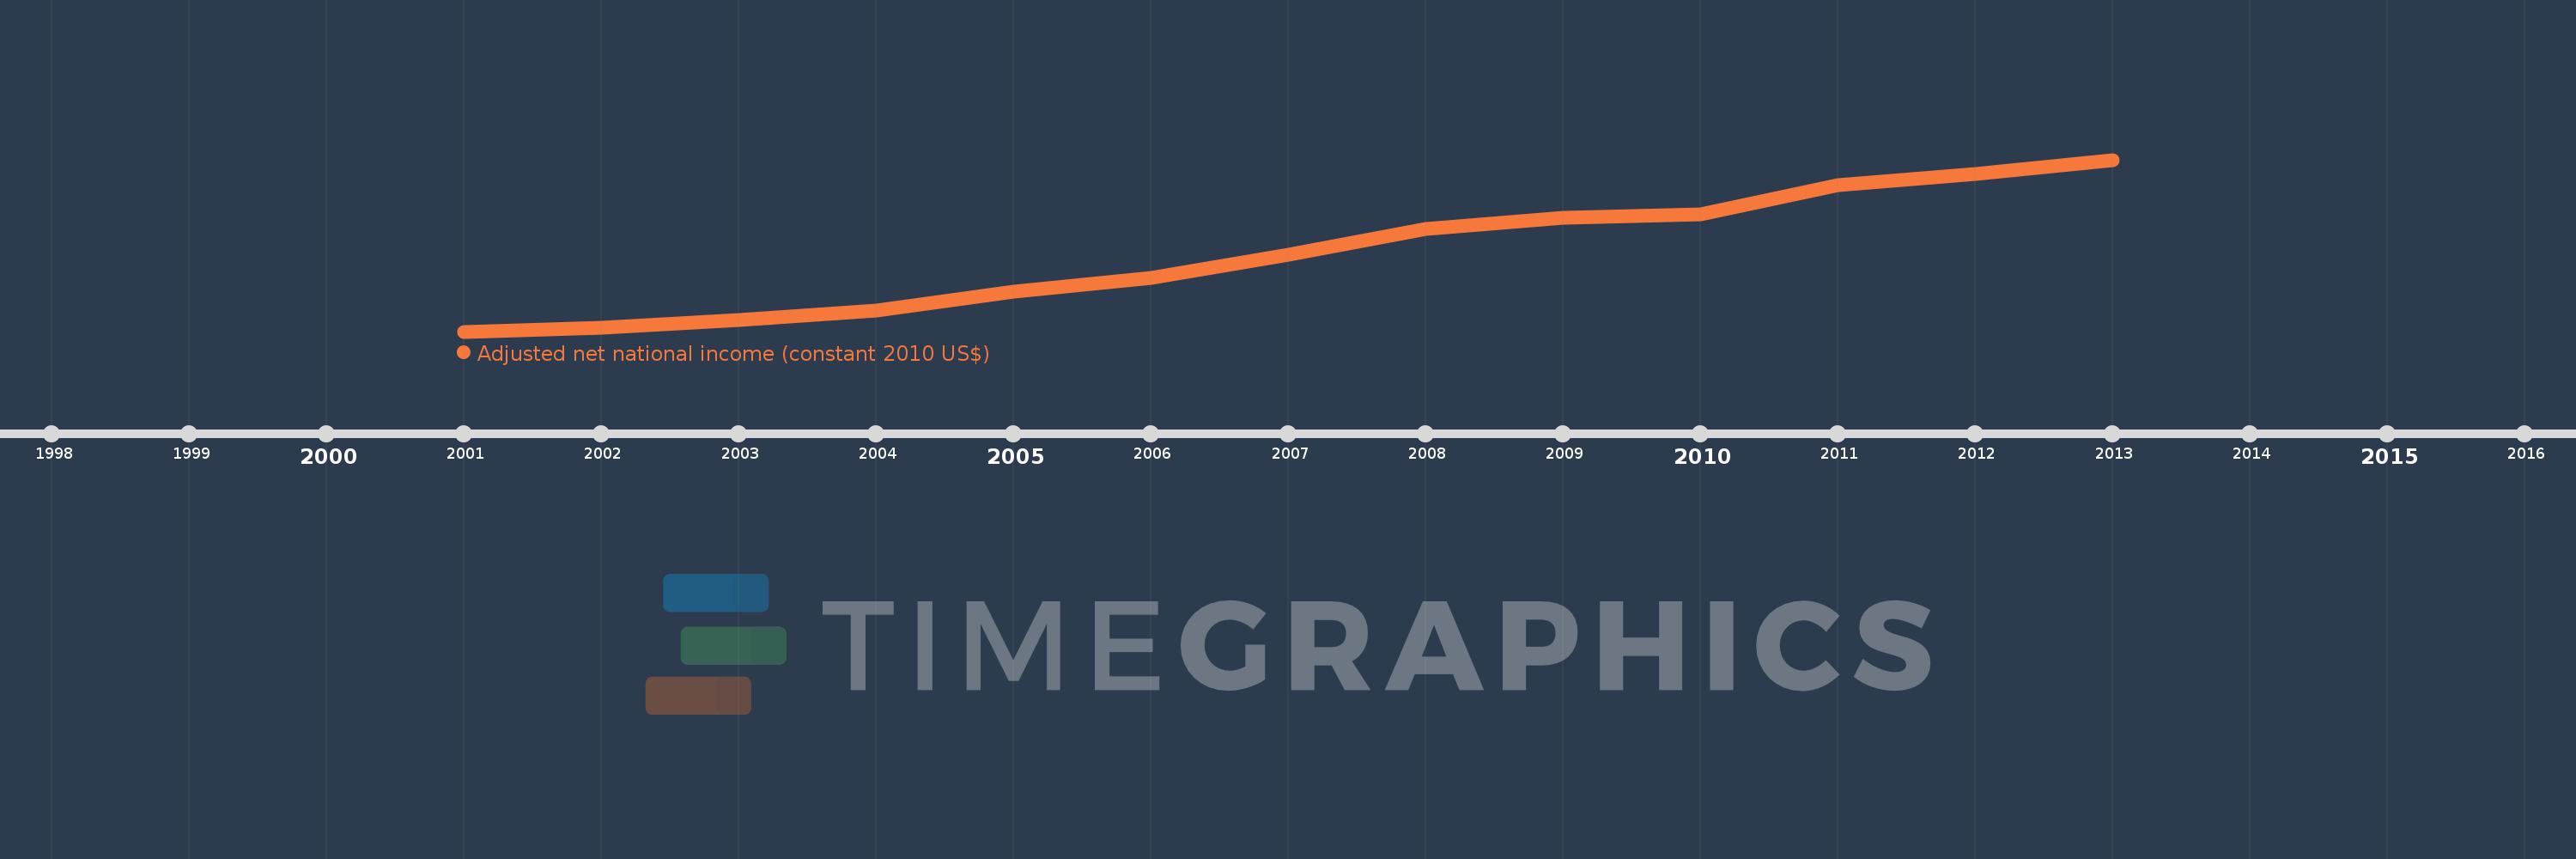
This timeline shows a graph from 2001 to 2013 of Low & middle income. No data until 2000. Number of actual observations by date: 13.
Source name:
World Development Indicators
Source organization:
World Bank staff estimates based on sources and methods in World Bank's "The Changing Wealth of Nations: Measuring Sustainable Development in the New Millennium" (2011).
Categories, topics:
Economy & Growth
Last updated:
apr 23, 2017
Indicators value changes by year
Meaning:
13.92 trl
Minimum:
10.279 trl
jan 1, 2001
Maximum:
18.268 trl
jan 1, 2013
At the date of observation
Value
Absolute change
Change from the previous value
jan 1, 2001
10.279 trl
+10.279 trl
0.0%
jan 1, 2002
10.478 trl
+198.237 bln
1.93%
jan 1, 2003
10.804 trl
+325.941 bln
3.11%
jan 1, 2004
11.257 trl
+453.521 bln
4.2%
jan 1, 2005
12.152 trl
+894.995 bln
7.95%
jan 1, 2006
12.784 trl
+632.032 bln
5.2%
jan 1, 2007
13.852 trl
+1.068 trl
8.35%
jan 1, 2008
15.061 trl
+1.209 trl
8.73%
jan 1, 2009
15.563 trl
+502.2 bln
3.33%
jan 1, 2010
15.748 trl
+184.806 bln
1.19%
jan 1, 2011
17.089 trl
+1.34 trl
8.51%
jan 1, 2012
17.628 trl
+539.608 bln
3.16%
jan 1, 2013
18.268 trl
+639.545 bln
3.63%
Ranking of countries by current statistics by years