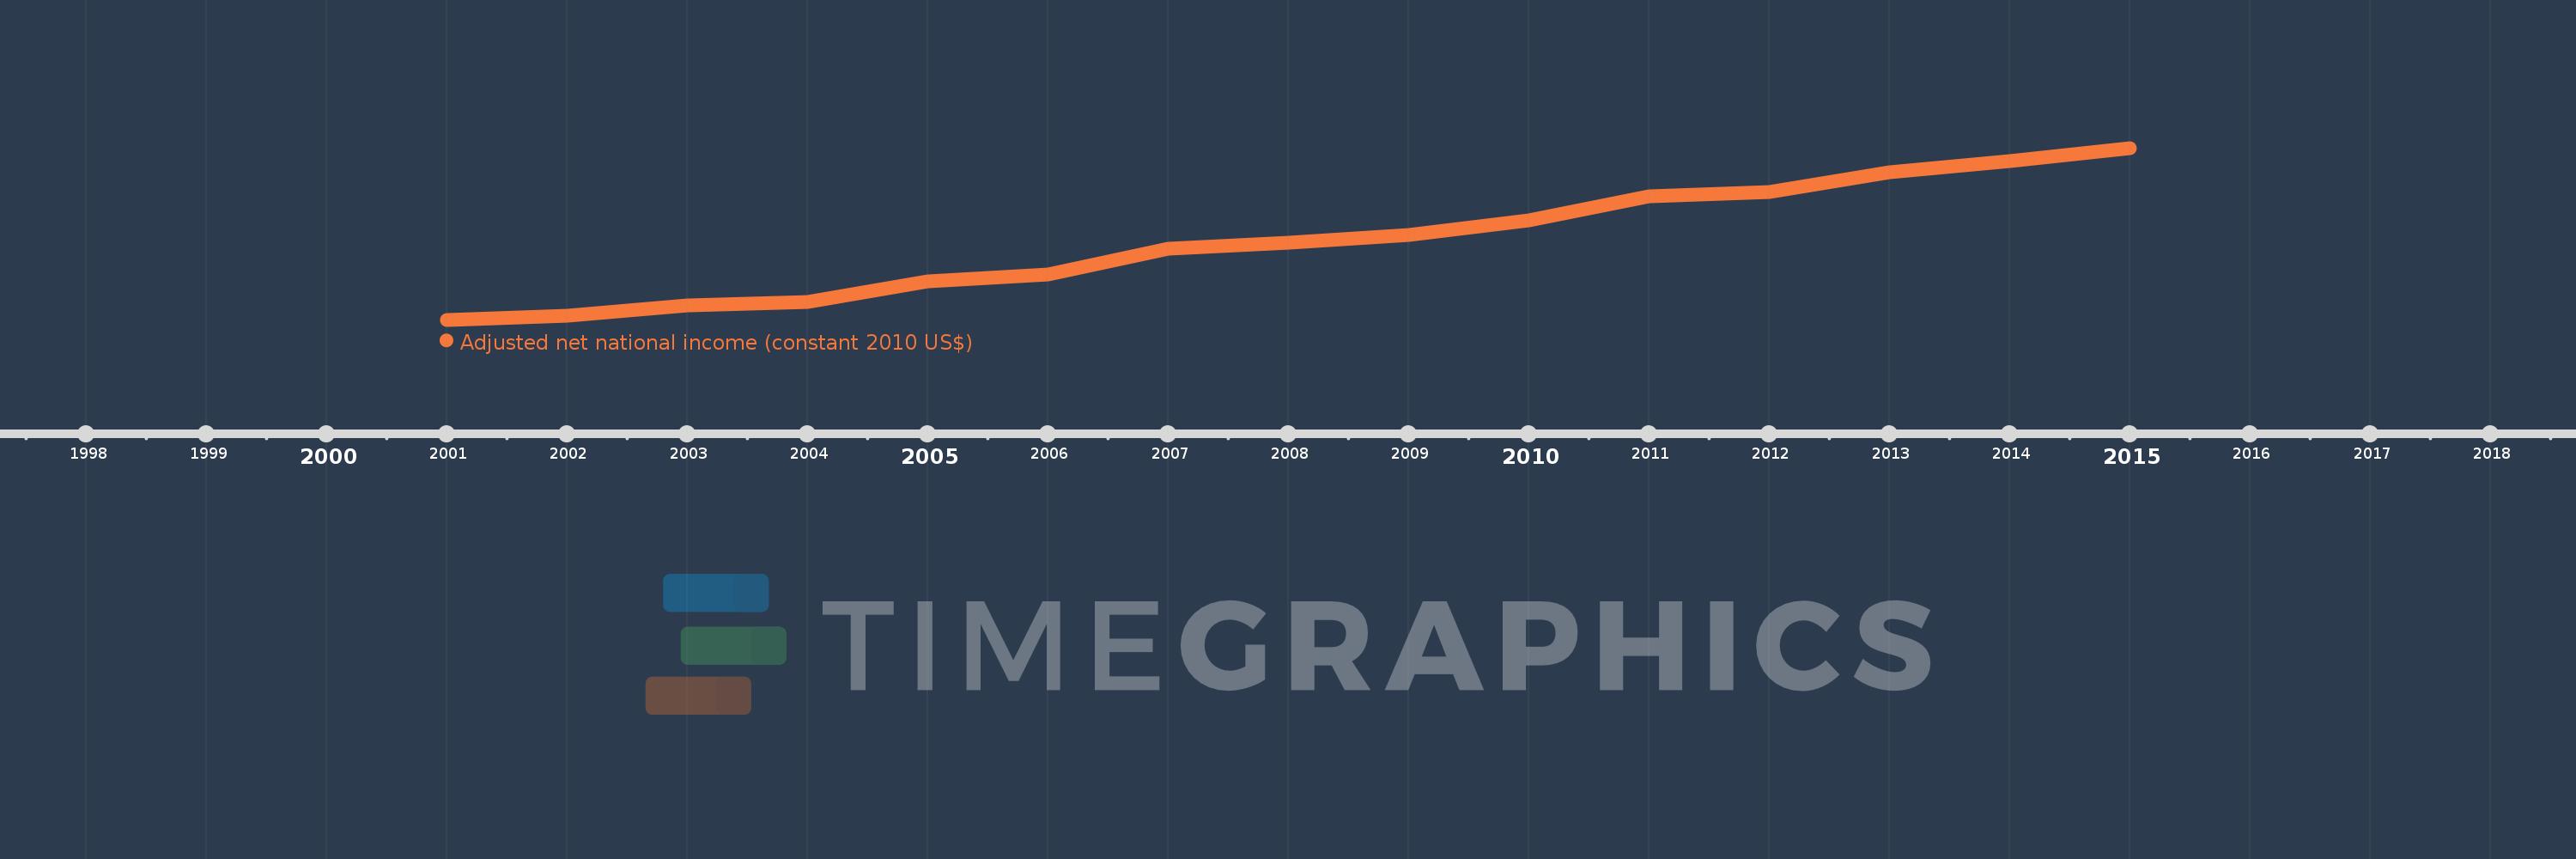
This timeline shows a graph from 2001 to 2015 of Sub-Saharan Africa (IDA & IBRD countries). No data until 2000. Number of actual observations by date: 15.
Source name:
World Development Indicators
Source organization:
World Bank staff estimates based on sources and methods in World Bank's "The Changing Wealth of Nations: Measuring Sustainable Development in the New Millennium" (2011).
Categories, topics:
Economy & Growth
Last updated:
apr 23, 2017
Indicators value changes by year
Meaning:
878.341 bln
Minimum:
578.517 bln
jan 1, 2001
Maximum:
1.233 trl
jan 1, 2015
At the date of observation
Value
Absolute change
Change from the previous value
jan 1, 2001
578.517 bln
+578.517 bln
0.0%
jan 1, 2002
592.462 bln
+13.945 bln
2.41%
jan 1, 2003
631.762 bln
+39.301 bln
6.63%
jan 1, 2004
647.12 bln
+15.358 bln
2.43%
jan 1, 2005
725.745 bln
+78.624 bln
12.15%
jan 1, 2006
751.68 bln
+25.935 bln
3.57%
jan 1, 2007
848.209 bln
+96.529 bln
12.84%
jan 1, 2008
870.988 bln
+22.779 bln
2.69%
jan 1, 2009
902.597 bln
+31.61 bln
3.63%
jan 1, 2010
956.701 bln
+54.104 bln
5.99%
jan 1, 2011
1.049 trl
+92.607 bln
9.68%
jan 1, 2012
1.066 trl
+17.129 bln
1.63%
jan 1, 2013
1.139 trl
+72.392 bln
6.79%
jan 1, 2014
1.182 trl
+42.879 bln
3.77%
jan 1, 2015
1.233 trl
+51.339 bln
4.34%
Ranking of countries by current statistics by years