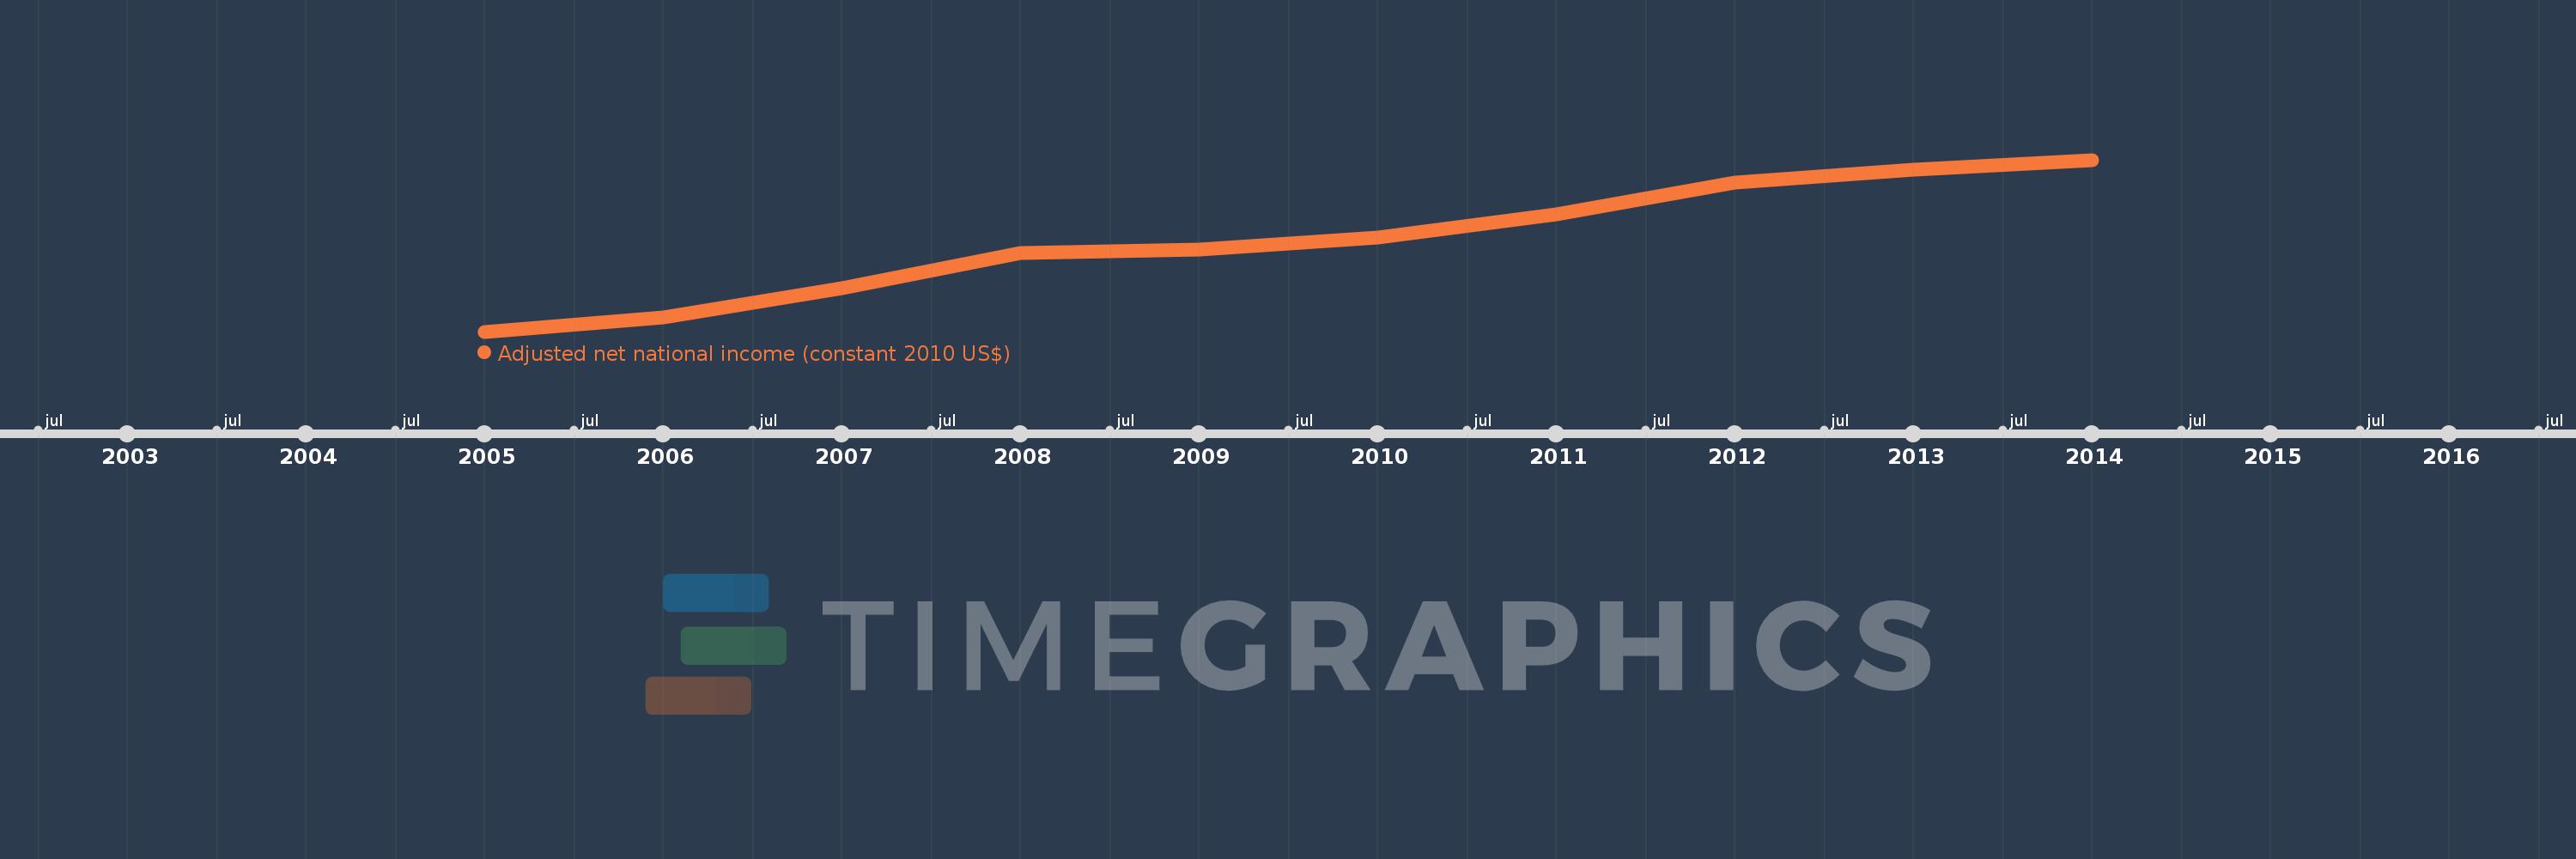
This timeline shows a graph from 2005 to 2014 of Middle East & North Africa. No data until 2004. Number of actual observations by date: 10.
Source name:
World Development Indicators
Source organization:
World Bank staff estimates based on sources and methods in World Bank's "The Changing Wealth of Nations: Measuring Sustainable Development in the New Millennium" (2011).
Categories, topics:
Economy & Growth
Last updated:
apr 23, 2017
Indicators value changes by year
Meaning:
1.913 trl
Minimum:
1.437 trl
jan 1, 2005
Maximum:
2.333 trl
jan 1, 2014
At the date of observation
Value
Absolute change
Change from the previous value
jan 1, 2005
1.437 trl
+1.437 trl
0.0%
jan 1, 2006
1.511 trl
+74.056 bln
5.15%
jan 1, 2007
1.665 trl
+153.84 bln
10.18%
jan 1, 2008
1.847 trl
+182.265 bln
10.95%
jan 1, 2009
1.865 trl
+17.956 bln
0.97%
jan 1, 2010
1.925 trl
+60.482 bln
3.24%
jan 1, 2011
2.048 trl
+122.948 bln
6.39%
jan 1, 2012
2.215 trl
+166.717 bln
8.14%
jan 1, 2013
2.28 trl
+64.781 bln
2.92%
jan 1, 2014
2.333 trl
+53.124 bln
2.33%
Ranking of countries by current statistics by years