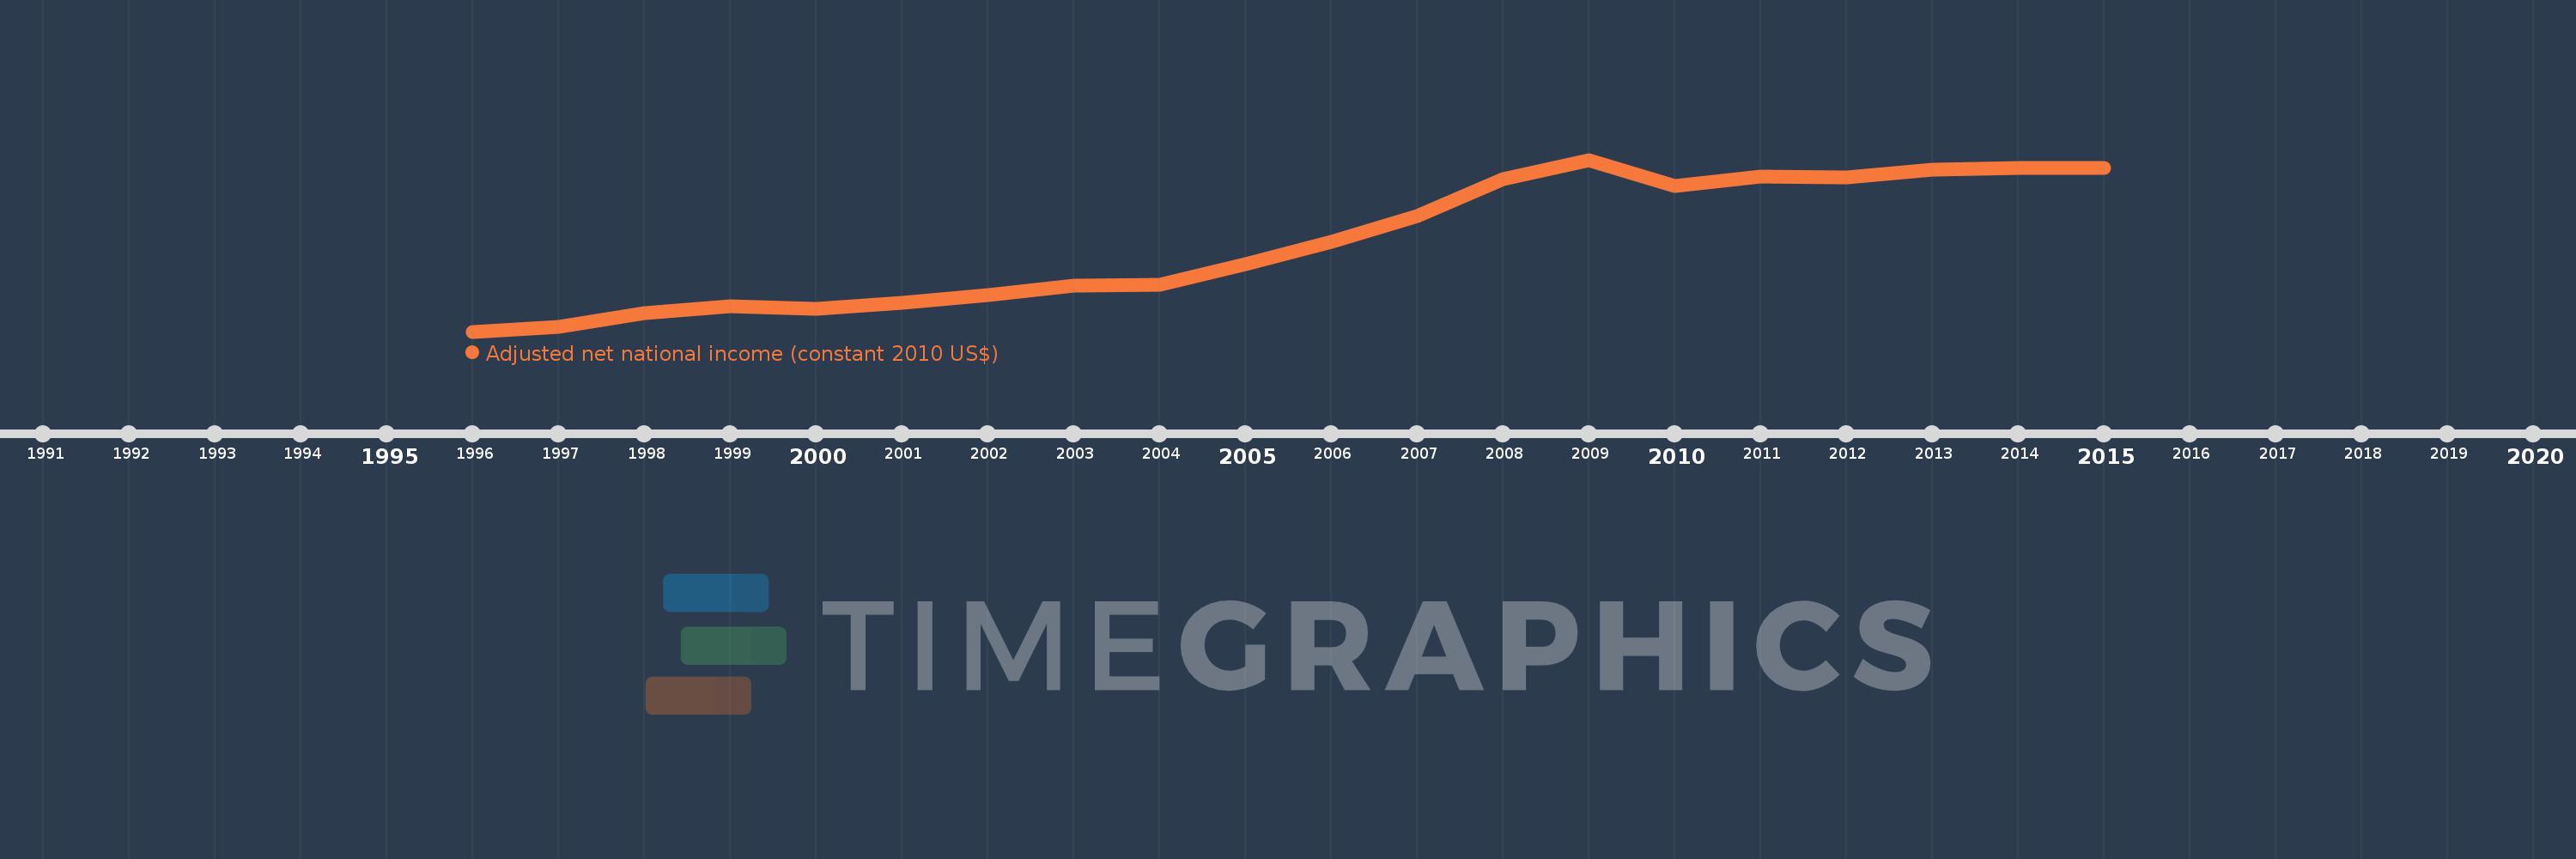
This timeline shows a graph from 1996 to 2015 of Slovak Republic. No data until 1995. Number of actual observations by date: 20.
Source name:
World Development Indicators
Source organization:
World Bank staff estimates based on sources and methods in World Bank's "The Changing Wealth of Nations: Measuring Sustainable Development in the New Millennium" (2011).
Categories, topics:
Economy & Growth
Last updated:
apr 23, 2017
Indicators value changes by year
Meaning:
55.757 bln
Minimum:
38.082 bln
jan 1, 1996
Maximum:
72.416 bln
jan 1, 2009
At the date of observation
Value
Absolute change
Change from the previous value
jan 1, 1996
38.082 bln
+38.082 bln
0.0%
jan 1, 1997
38.965 bln
+882.415 mln
2.32%
jan 1, 1998
41.745 bln
+2.78 bln
7.14%
jan 1, 1999
43.071 bln
+1.326 bln
3.18%
jan 1, 2000
42.549 bln
-522.35 mln
-1.21%
jan 1, 2001
43.859 bln
+1.31 bln
3.08%
jan 1, 2002
45.373 bln
+1.514 bln
3.45%
jan 1, 2003
47.293 bln
+1.921 bln
4.23%
jan 1, 2004
47.433 bln
+139.556 mln
0.3%
jan 1, 2005
51.549 bln
+4.117 bln
8.68%
jan 1, 2006
55.976 bln
+4.426 bln
8.59%
jan 1, 2007
61.191 bln
+5.215 bln
9.32%
jan 1, 2008
68.505 bln
+7.313 bln
11.95%
jan 1, 2009
72.416 bln
+3.911 bln
5.71%
jan 1, 2010
67.147 bln
-5.269 bln
-7.28%
jan 1, 2011
69.002 bln
+1.855 bln
2.76%
jan 1, 2012
68.849 bln
-153.242 mln
-0.22%
jan 1, 2013
70.419 bln
+1.57 bln
2.28%
jan 1, 2014
70.859 bln
+440.529 mln
0.63%
jan 1, 2015
70.849 bln
-10.157 mln
-0.01%
Ranking of countries by current statistics by years