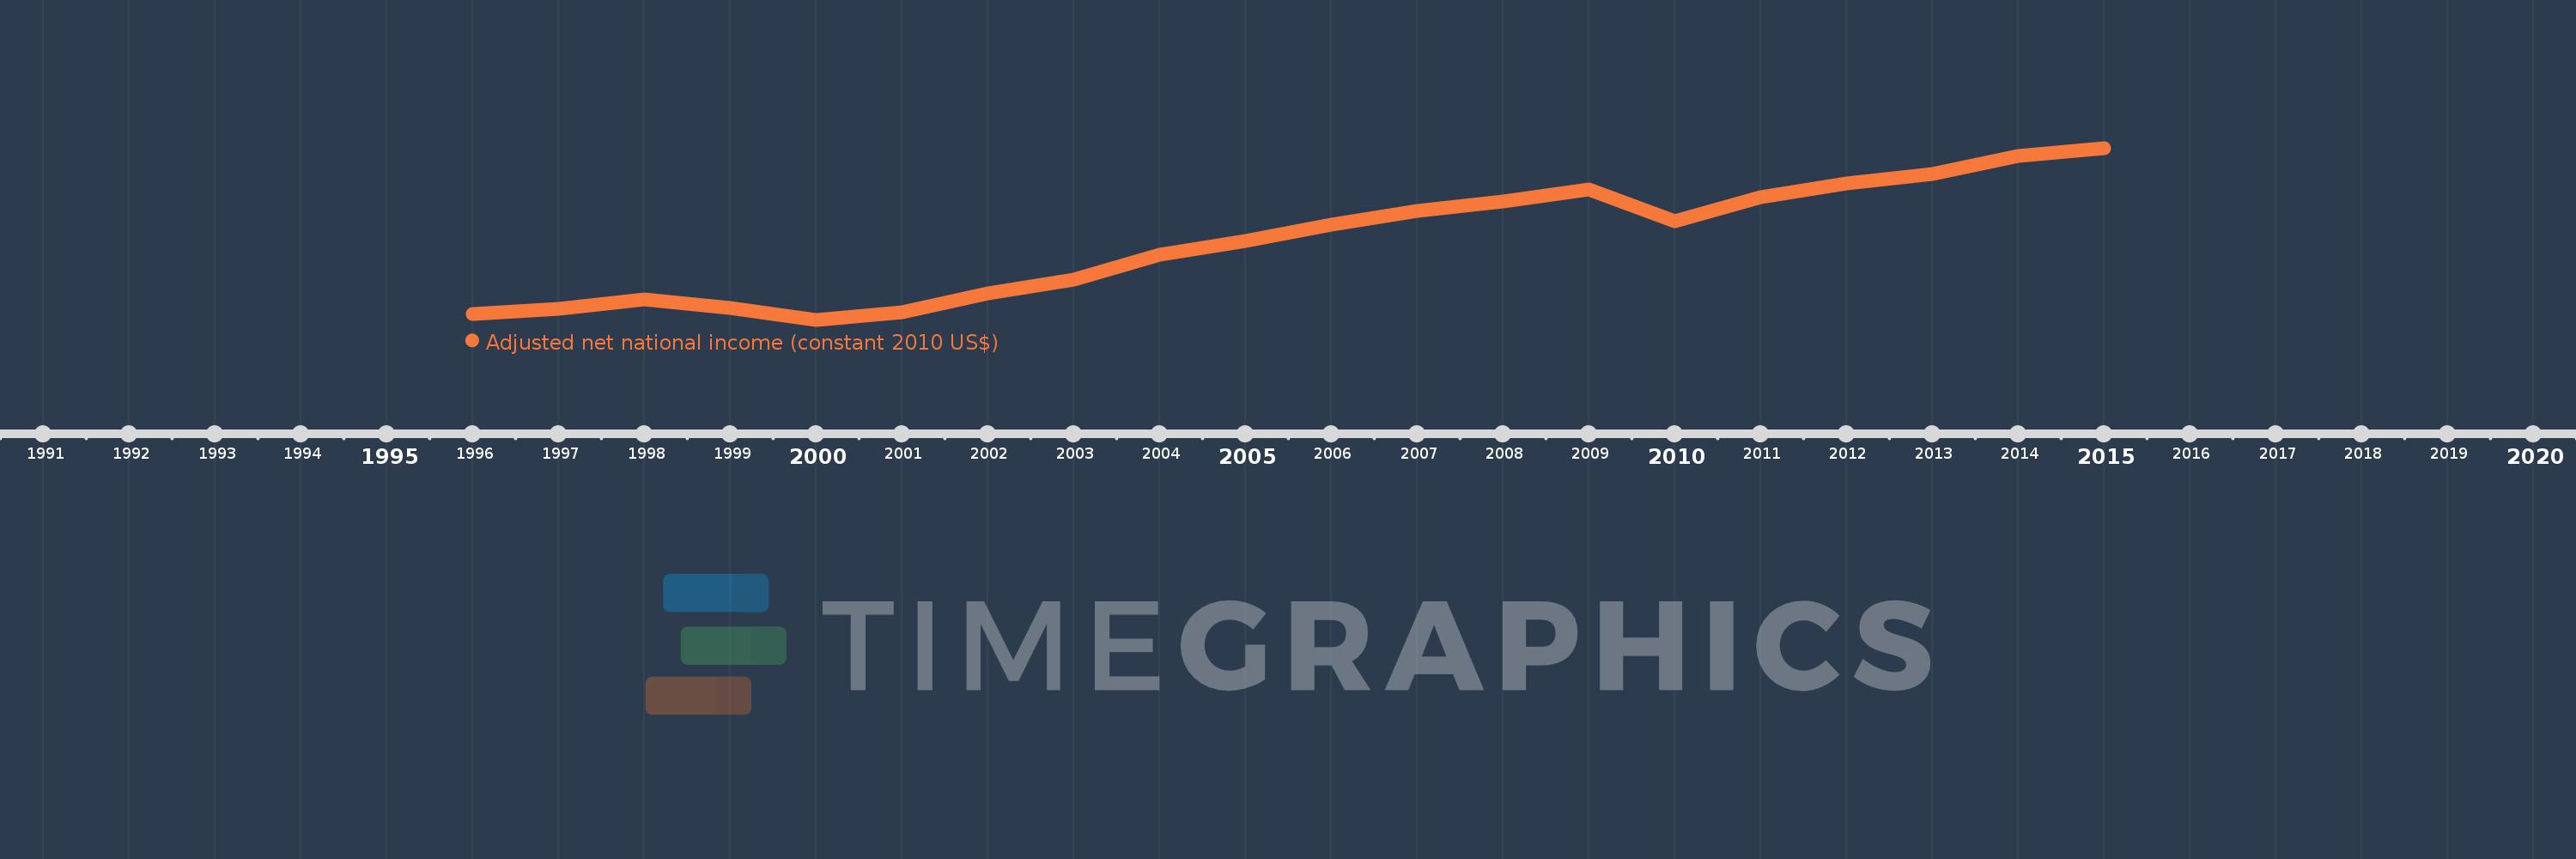
This timeline shows a graph from 1996 to 2015 of Moldova. No data until 1995. Number of actual observations by date: 20.
Source name:
World Development Indicators
Source organization:
World Bank staff estimates based on sources and methods in World Bank's "The Changing Wealth of Nations: Measuring Sustainable Development in the New Millennium" (2011).
Categories, topics:
Economy & Growth
Last updated:
apr 23, 2017
Indicators value changes by year
Meaning:
4.633 bln
Minimum:
2.792 bln
jan 1, 2000
Maximum:
6.851 bln
jan 1, 2015
At the date of observation
Value
Absolute change
Change from the previous value
jan 1, 1996
2.936 bln
+2.936 bln
0.0%
jan 1, 1997
3.047 bln
+111.647 mln
3.8%
jan 1, 1998
3.276 bln
+228.512 mln
7.5%
jan 1, 1999
3.066 bln
-210.332 mln
-6.42%
jan 1, 2000
2.792 bln
-273.935 mln
-8.94%
jan 1, 2001
2.977 bln
+185.528 mln
6.65%
jan 1, 2002
3.422 bln
+444.58 mln
14.93%
jan 1, 2003
3.731 bln
+308.958 mln
9.03%
jan 1, 2004
4.33 bln
+599.723 mln
16.08%
jan 1, 2005
4.646 bln
+315.907 mln
7.3%
jan 1, 2006
5.045 bln
+398.557 mln
8.58%
jan 1, 2007
5.36 bln
+314.673 mln
6.24%
jan 1, 2008
5.594 bln
+234.622 mln
4.38%
jan 1, 2009
5.863 bln
+269.181 mln
4.81%
jan 1, 2010
5.119 bln
-744.182 mln
-12.69%
jan 1, 2011
5.697 bln
+577.711 mln
11.29%
jan 1, 2012
6.005 bln
+308.277 mln
5.41%
jan 1, 2013
6.239 bln
+233.723 mln
3.89%
jan 1, 2014
6.66 bln
+421.126 mln
6.75%
jan 1, 2015
6.851 bln
+190.935 mln
2.87%
Ranking of countries by current statistics by years