33
/
AIzaSyAYiBZKx7MnpbEhh9jyipgxe19OcubqV5w
August 1, 2025
117574
Czech Republic
CZE
true
2
1
Adjusted net national income (constant 2010 US$)
2015,2014,2013,2012,2011,2010,2009,2008,2007,2006,2005,2004,2003,2002,2001,2000,1999,1998,1997,1996,1995,1994
Download
Global statistics library →Czech Republic →

Adjusted net national income (constant 2010 US$)

This statistics in other country:

AfghanistanAlbaniaAlgeriaAngolaArab WorldArgentinaArmeniaAustraliaAustriaAzerbaijanBahamas, TheBahrainBangladeshBarbadosBelarusBelgiumBelizeBeninBhutanBoliviaBotswanaBrazilBulgariaBurkina FasoBurundiCabo VerdeCambodiaCameroonCanadaCaribbean small statesCentral African RepublicCentral Europe and the BalticsChadChileChinaColombiaComorosCongo, Dem. Rep.Congo, Rep.Costa RicaCote d'IvoireCroatiaCubaCyprusCzech RepublicDenmarkDominicaDominican RepublicEarly-demographic dividendEast Asia & PacificEast Asia & Pacific (excluding high income)East Asia & Pacific (IDA & IBRD countries)EcuadorEgypt, Arab Rep.El SalvadorEritreaEstoniaEthiopiaEuro areaEurope & Central AsiaEurope & Central Asia (excluding high income)Europe & Central Asia (IDA & IBRD countries)European UnionFijiFinlandFragile and conflict affected situationsFranceGabonGambia, TheGeorgiaGermanyGhanaGreeceGuatemalaGuineaGuinea-BissauGuyanaHaitiHeavily indebted poor countries (HIPC)High incomeHondurasHungaryIBRD onlyIDA & IBRD totalIDA blendIDA onlyIDA totalIndiaIndonesiaIran, Islamic Rep.IraqIrelandIsraelItalyJamaicaJapanJordanKazakhstanKenyaKiribatiKorea, Rep.KuwaitKyrgyz RepublicLao PDRLate-demographic dividendLatin America & Caribbean Latin America & Caribbean (excluding high income)Latin America & the Caribbean (IDA & IBRD countries)LatviaLeast developed countries: UN classificationLebanonLesothoLiberiaLibyaLithuaniaLow & middle incomeLow incomeLower middle incomeLuxembourgMacedonia, FYRMadagascarMalawiMalaysiaMaldivesMaliMauritaniaMauritiusMexicoMiddle East & North AfricaMiddle East & North Africa (excluding high income)Middle East & North Africa (IDA & IBRD countries)Middle incomeMoldovaMongoliaMoroccoMozambiqueNamibiaNepalNetherlandsNew ZealandNicaraguaNigerNigeriaNorth AmericaNorwayOECD membersOmanOther small statesPacific island small statesPakistanPanamaPapua New GuineaParaguayPeruPhilippinesPolandPortugalPost-demographic dividendPre-demographic dividendQatarRomaniaRussian FederationRwandaSamoaSao Tome and PrincipeSaudi ArabiaSenegalSeychellesSierra LeoneSingaporeSlovak RepublicSloveniaSmall statesSolomon IslandsSouth AfricaSouth AsiaSouth Asia (IDA & IBRD)SpainSri LankaSt. LuciaSt. Vincent and the GrenadinesSub-Saharan Africa Sub-Saharan Africa (excluding high income)Sub-Saharan Africa (IDA & IBRD countries)SurinameSwazilandSwedenSwitzerlandTajikistanTanzaniaThailandTogoTongaTrinidad and TobagoTunisiaTurkeyTurkmenistanUgandaUkraineUnited Arab EmiratesUnited KingdomUnited StatesUpper middle incomeUruguayUzbekistanVanuatuVenezuela, RBVietnamWorldYemen, Rep.ZambiaZimbabwe

Timeline:

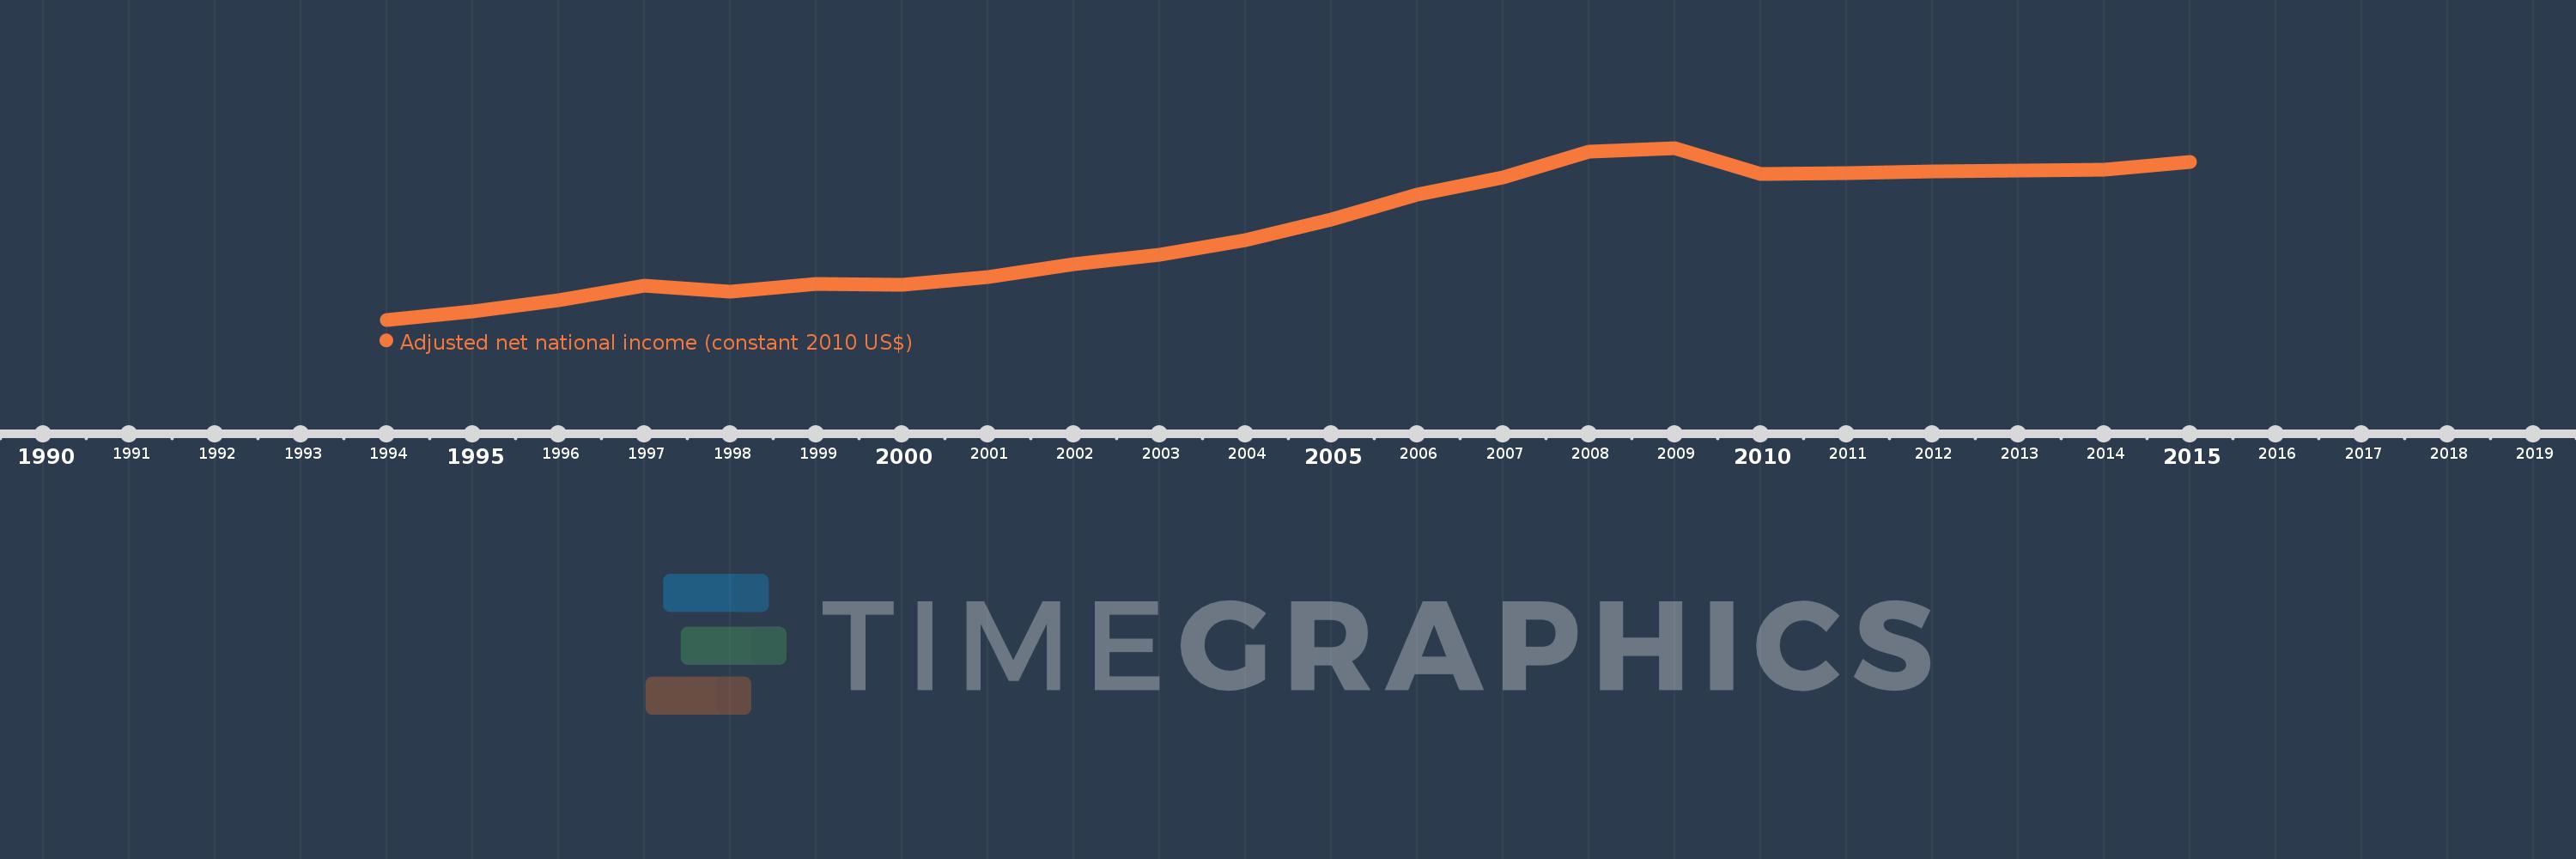
This timeline shows a graph from 1994 to 2015 of Czech Republic. No data until 1993. Number of actual observations by date: 22.

Source name:

World Development Indicators

Source organization:

World Bank staff estimates based on sources and methods in World Bank's "The Changing Wealth of Nations: Measuring Sustainable Development in the New Millennium" (2011).

Categories, topics:

Economy & Growth

Last updated:

apr 23, 2017

Indicators value changes by year

Meaning:
128.224 bln
Minimum:
98.029 bln
jan 1, 1994
Maximum:
154.834 bln
jan 1, 2009
At the date of observation
Value
Absolute change
Change from the previous value
jan 1, 1994
98.029 bln
+98.029 bln
0.0%
jan 1, 1995
100.848 bln
+2.819 bln
2.88%
jan 1, 1996
104.498 bln
+3.65 bln
3.62%
jan 1, 1997
109.443 bln
+4.945 bln
4.73%
jan 1, 1998
107.32 bln
-2.122 bln
-1.94%
jan 1, 1999
109.736 bln
+2.416 bln
2.25%
jan 1, 2000
109.663 bln
-73.123 mln
-0.07%
jan 1, 2001
112.089 bln
+2.426 bln
2.21%
jan 1, 2002
116.328 bln
+4.239 bln
3.78%
jan 1, 2003
119.463 bln
+3.135 bln
2.69%
jan 1, 2004
124.43 bln
+4.967 bln
4.16%
jan 1, 2005
131.064 bln
+6.634 bln
5.33%
jan 1, 2006
139.494 bln
+8.43 bln
6.43%
jan 1, 2007
145.197 bln
+5.703 bln
4.09%
jan 1, 2008
153.561 bln
+8.365 bln
5.76%
jan 1, 2009
154.834 bln
+1.272 bln
0.83%
jan 1, 2010
146.143 bln
-8.69 bln
-5.61%
jan 1, 2011
146.375 bln
+231.987 mln
0.16%
jan 1, 2012
146.991 bln
+615.535 mln
0.42%
jan 1, 2013
147.483 bln
+492.348 mln
0.33%
jan 1, 2014
147.667 bln
+183.721 mln
0.12%
jan 1, 2015
150.262 bln
+2.595 bln
1.76%

Ranking of countries by current statistics by years