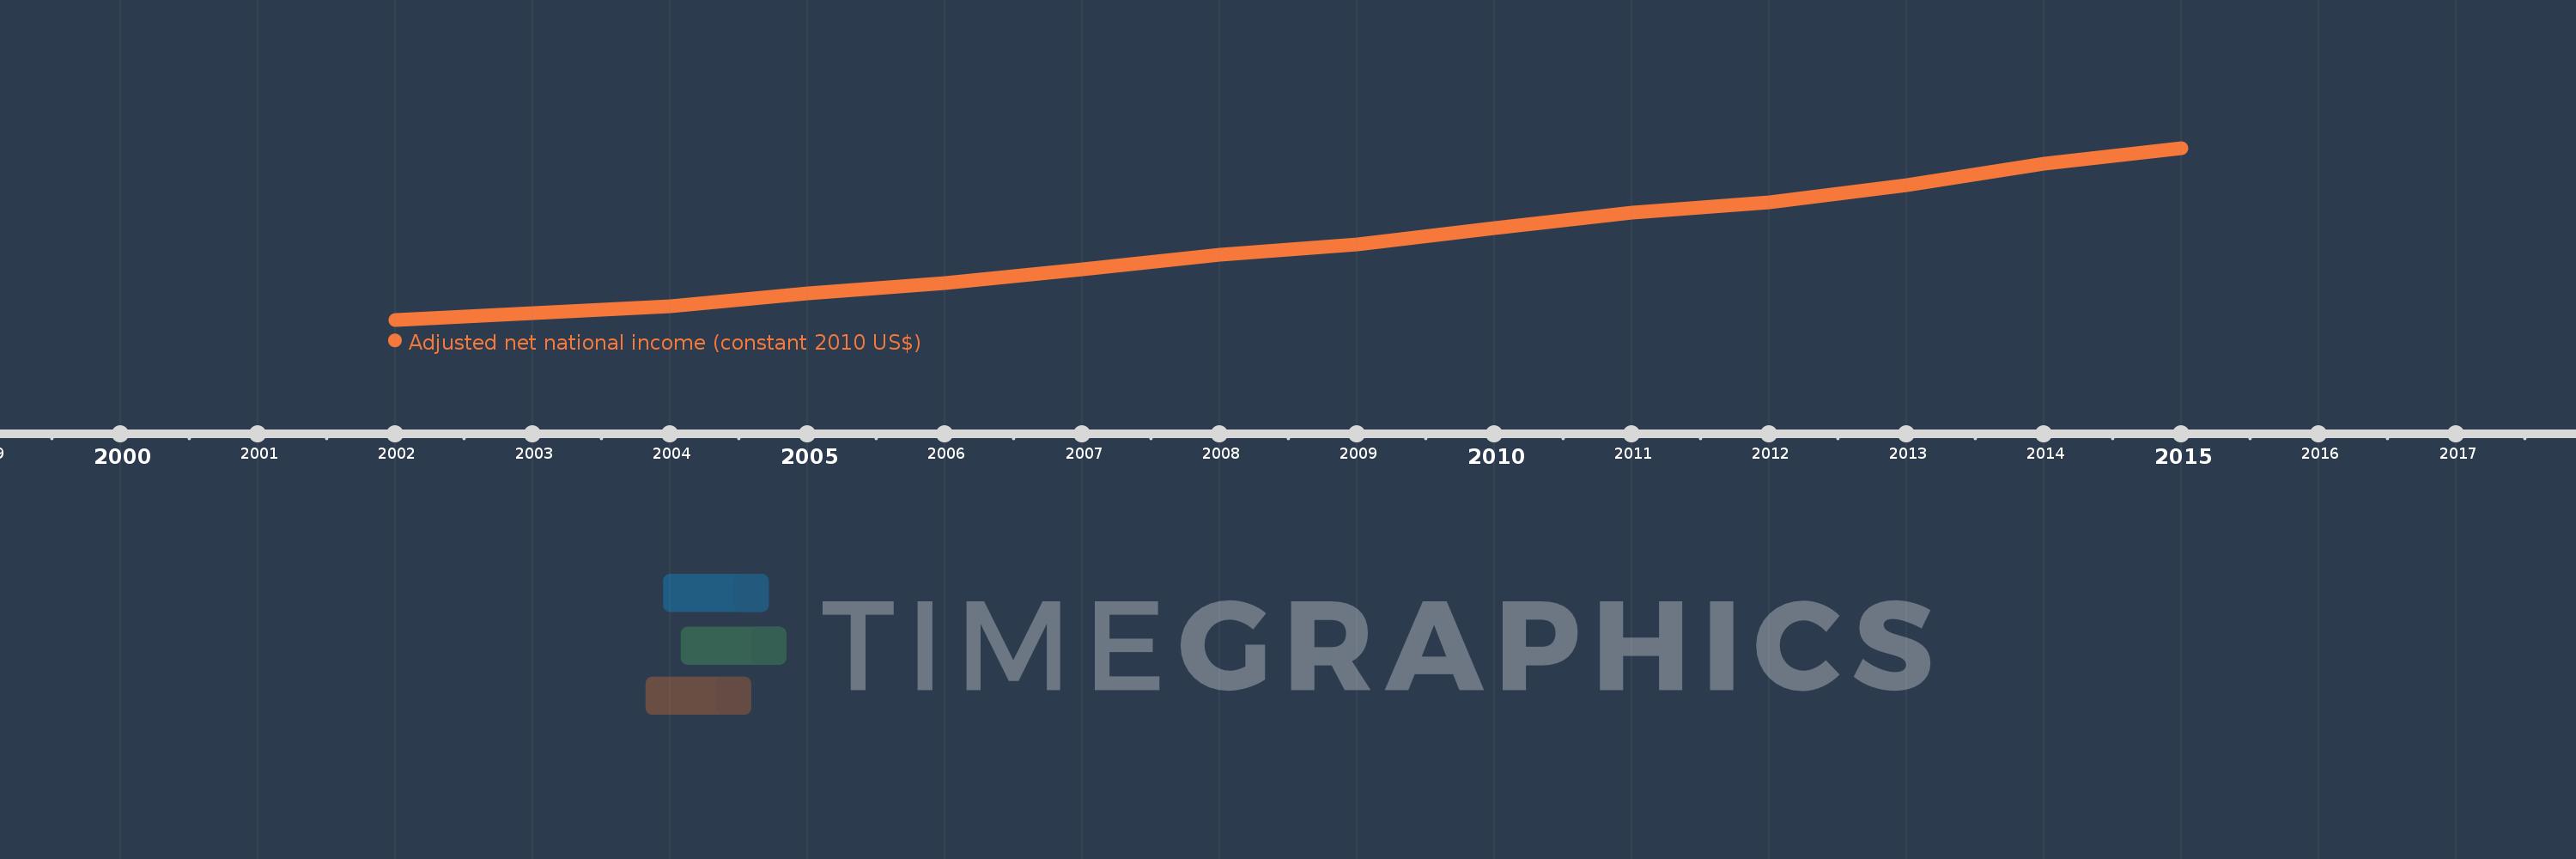
This timeline shows a graph from 2002 to 2015 of IDA only. No data until 2001. Number of actual observations by date: 14.
Source name:
World Development Indicators
Source organization:
World Bank staff estimates based on sources and methods in World Bank's "The Changing Wealth of Nations: Measuring Sustainable Development in the New Millennium" (2011).
Categories, topics:
Economy & Growth
Last updated:
apr 23, 2017
Indicators value changes by year
Meaning:
578.617 bln
Minimum:
409.418 bln
jan 1, 2002
Maximum:
795.953 bln
jan 1, 2015
At the date of observation
Value
Absolute change
Change from the previous value
jan 1, 2002
409.418 bln
+409.418 bln
0.0%
jan 1, 2003
423.59 bln
+14.172 bln
3.46%
jan 1, 2004
440.224 bln
+16.634 bln
3.93%
jan 1, 2005
468.095 bln
+27.871 bln
6.33%
jan 1, 2006
492.558 bln
+24.463 bln
5.23%
jan 1, 2007
522.793 bln
+30.235 bln
6.14%
jan 1, 2008
555.331 bln
+32.538 bln
6.22%
jan 1, 2009
579.34 bln
+24.009 bln
4.32%
jan 1, 2010
615.323 bln
+35.983 bln
6.21%
jan 1, 2011
650.815 bln
+35.492 bln
5.77%
jan 1, 2012
674.164 bln
+23.349 bln
3.59%
jan 1, 2013
713.106 bln
+38.942 bln
5.78%
jan 1, 2014
759.934 bln
+46.828 bln
6.57%
jan 1, 2015
795.953 bln
+36.019 bln
4.74%
Ranking of countries by current statistics by years