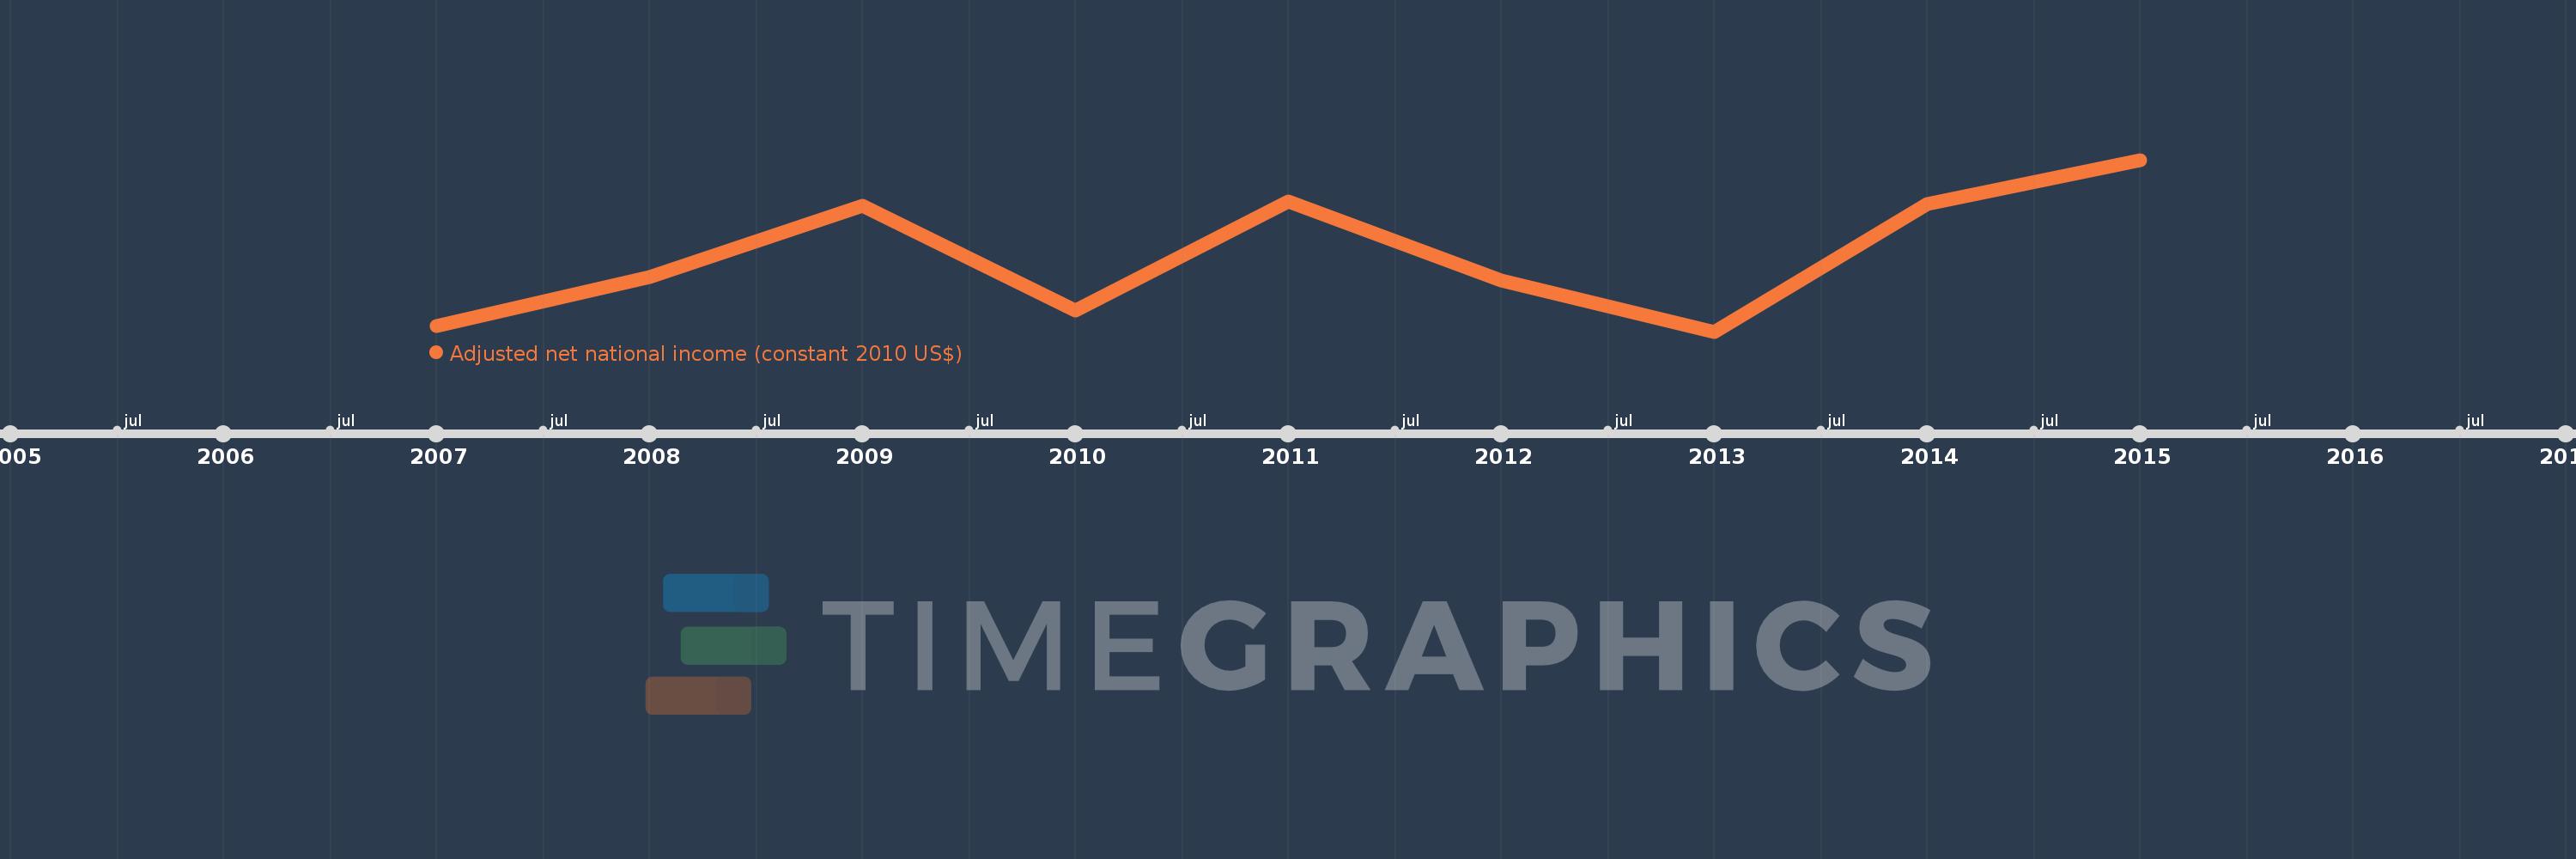
This timeline shows a graph from 2007 to 2015 of Guinea. No data until 2006. Number of actual observations by date: 9.
Source name:
World Development Indicators
Source organization:
World Bank staff estimates based on sources and methods in World Bank's "The Changing Wealth of Nations: Measuring Sustainable Development in the New Millennium" (2011).
Categories, topics:
Economy & Growth
Last updated:
apr 23, 2017
Indicators value changes by year
Meaning:
2.875 bln
Minimum:
2.661 bln
jan 1, 2013
Maximum:
3.142 bln
jan 1, 2015
At the date of observation
Value
Absolute change
Change from the previous value
jan 1, 2007
2.676 bln
+2.676 bln
0.0%
jan 1, 2008
2.815 bln
+139.132 mln
5.2%
jan 1, 2009
3.015 bln
+200.028 mln
7.11%
jan 1, 2010
2.72 bln
-294.195 mln
-9.76%
jan 1, 2011
3.025 bln
+304.095 mln
11.18%
jan 1, 2012
2.803 bln
-221.648 mln
-7.33%
jan 1, 2013
2.661 bln
-142.364 mln
-5.08%
jan 1, 2014
3.017 bln
+356.68 mln
13.41%
jan 1, 2015
3.142 bln
+125.231 mln
4.15%
Ranking of countries by current statistics by years