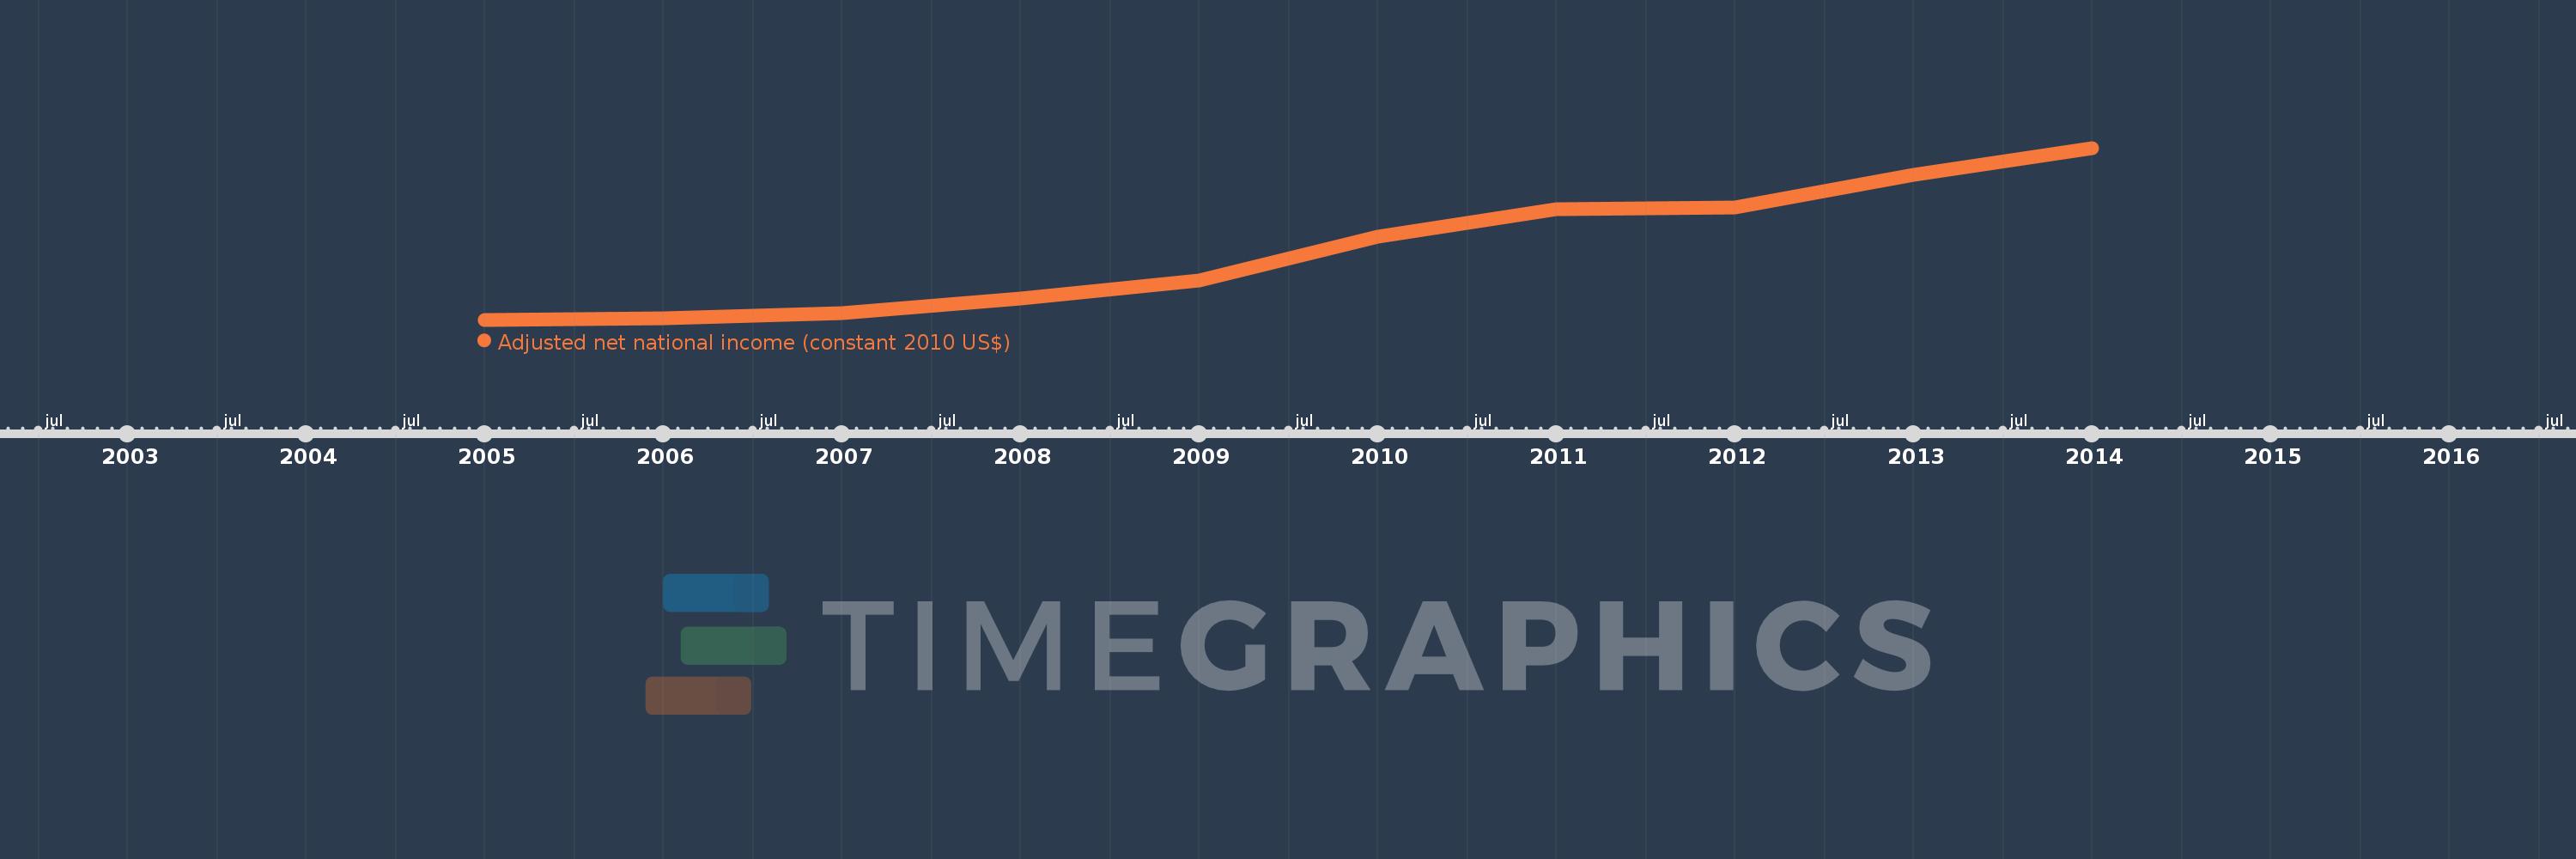
This timeline shows a graph from 2005 to 2014 of Tajikistan. No data until 2004. Number of actual observations by date: 10.
Source name:
World Development Indicators
Source organization:
World Bank staff estimates based on sources and methods in World Bank's "The Changing Wealth of Nations: Measuring Sustainable Development in the New Millennium" (2011).
Categories, topics:
Economy & Growth
Last updated:
apr 23, 2017
Indicators value changes by year
Meaning:
4.493 bln
Minimum:
3.436 bln
jan 1, 2005
Maximum:
6.064 bln
jan 1, 2014
At the date of observation
Value
Absolute change
Change from the previous value
jan 1, 2005
3.436 bln
+3.436 bln
0.0%
jan 1, 2006
3.455 bln
+18.651 mln
0.54%
jan 1, 2007
3.539 bln
+84.007 mln
2.43%
jan 1, 2008
3.763 bln
+224.254 mln
6.34%
jan 1, 2009
4.038 bln
+274.741 mln
7.3%
jan 1, 2010
4.708 bln
+669.616 mln
16.58%
jan 1, 2011
5.131 bln
+422.967 mln
8.98%
jan 1, 2012
5.147 bln
+16.757 mln
0.33%
jan 1, 2013
5.647 bln
+499.394 mln
9.7%
jan 1, 2014
6.064 bln
+417.263 mln
7.39%
Ranking of countries by current statistics by years