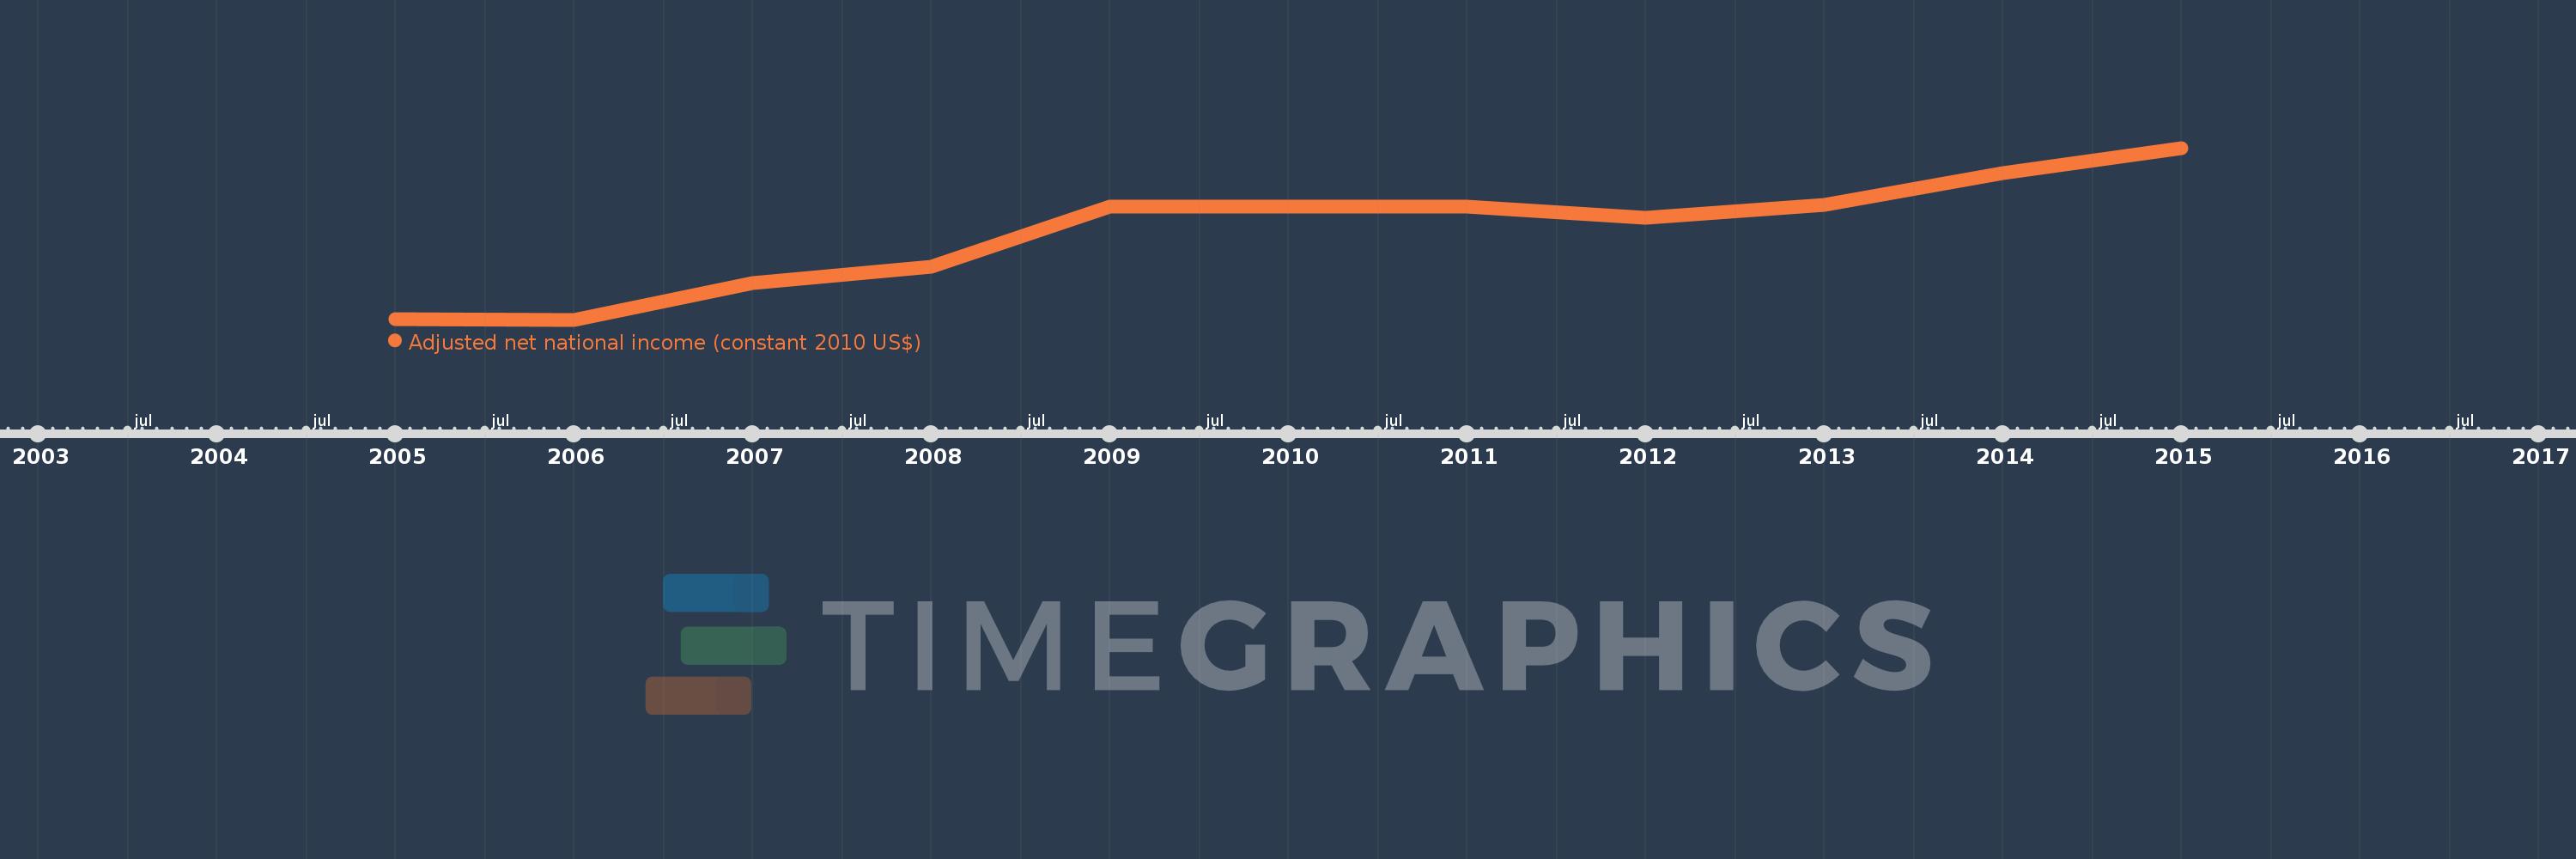
This timeline shows a graph from 2005 to 2015 of Vanuatu. No data until 2004. Number of actual observations by date: 11.
Source name:
World Development Indicators
Source organization:
World Bank staff estimates based on sources and methods in World Bank's "The Changing Wealth of Nations: Measuring Sustainable Development in the New Millennium" (2011).
Categories, topics:
Economy & Growth
Last updated:
apr 23, 2017
Indicators value changes by year
Meaning:
570.309 mln
Minimum:
434.099 mln
jan 1, 2006
Maximum:
700.861 mln
jan 1, 2015
At the date of observation
Value
Absolute change
Change from the previous value
jan 1, 2005
435.4 mln
+435.4 mln
0.0%
jan 1, 2006
434.099 mln
-1.301 mln
-0.3%
jan 1, 2007
491.476 mln
+57.377 mln
13.22%
jan 1, 2008
516.171 mln
+24.695 mln
5.02%
jan 1, 2009
609.602 mln
+93.43 mln
18.1%
jan 1, 2010
609.518 mln
-84.058K
-0.01%
jan 1, 2011
609.401 mln
-117.112K
-0.02%
jan 1, 2012
591.996 mln
-17.405 mln
-2.86%
jan 1, 2013
612.633 mln
+20.637 mln
3.49%
jan 1, 2014
662.24 mln
+49.607 mln
8.1%
jan 1, 2015
700.861 mln
+38.621 mln
5.83%
Ranking of countries by current statistics by years