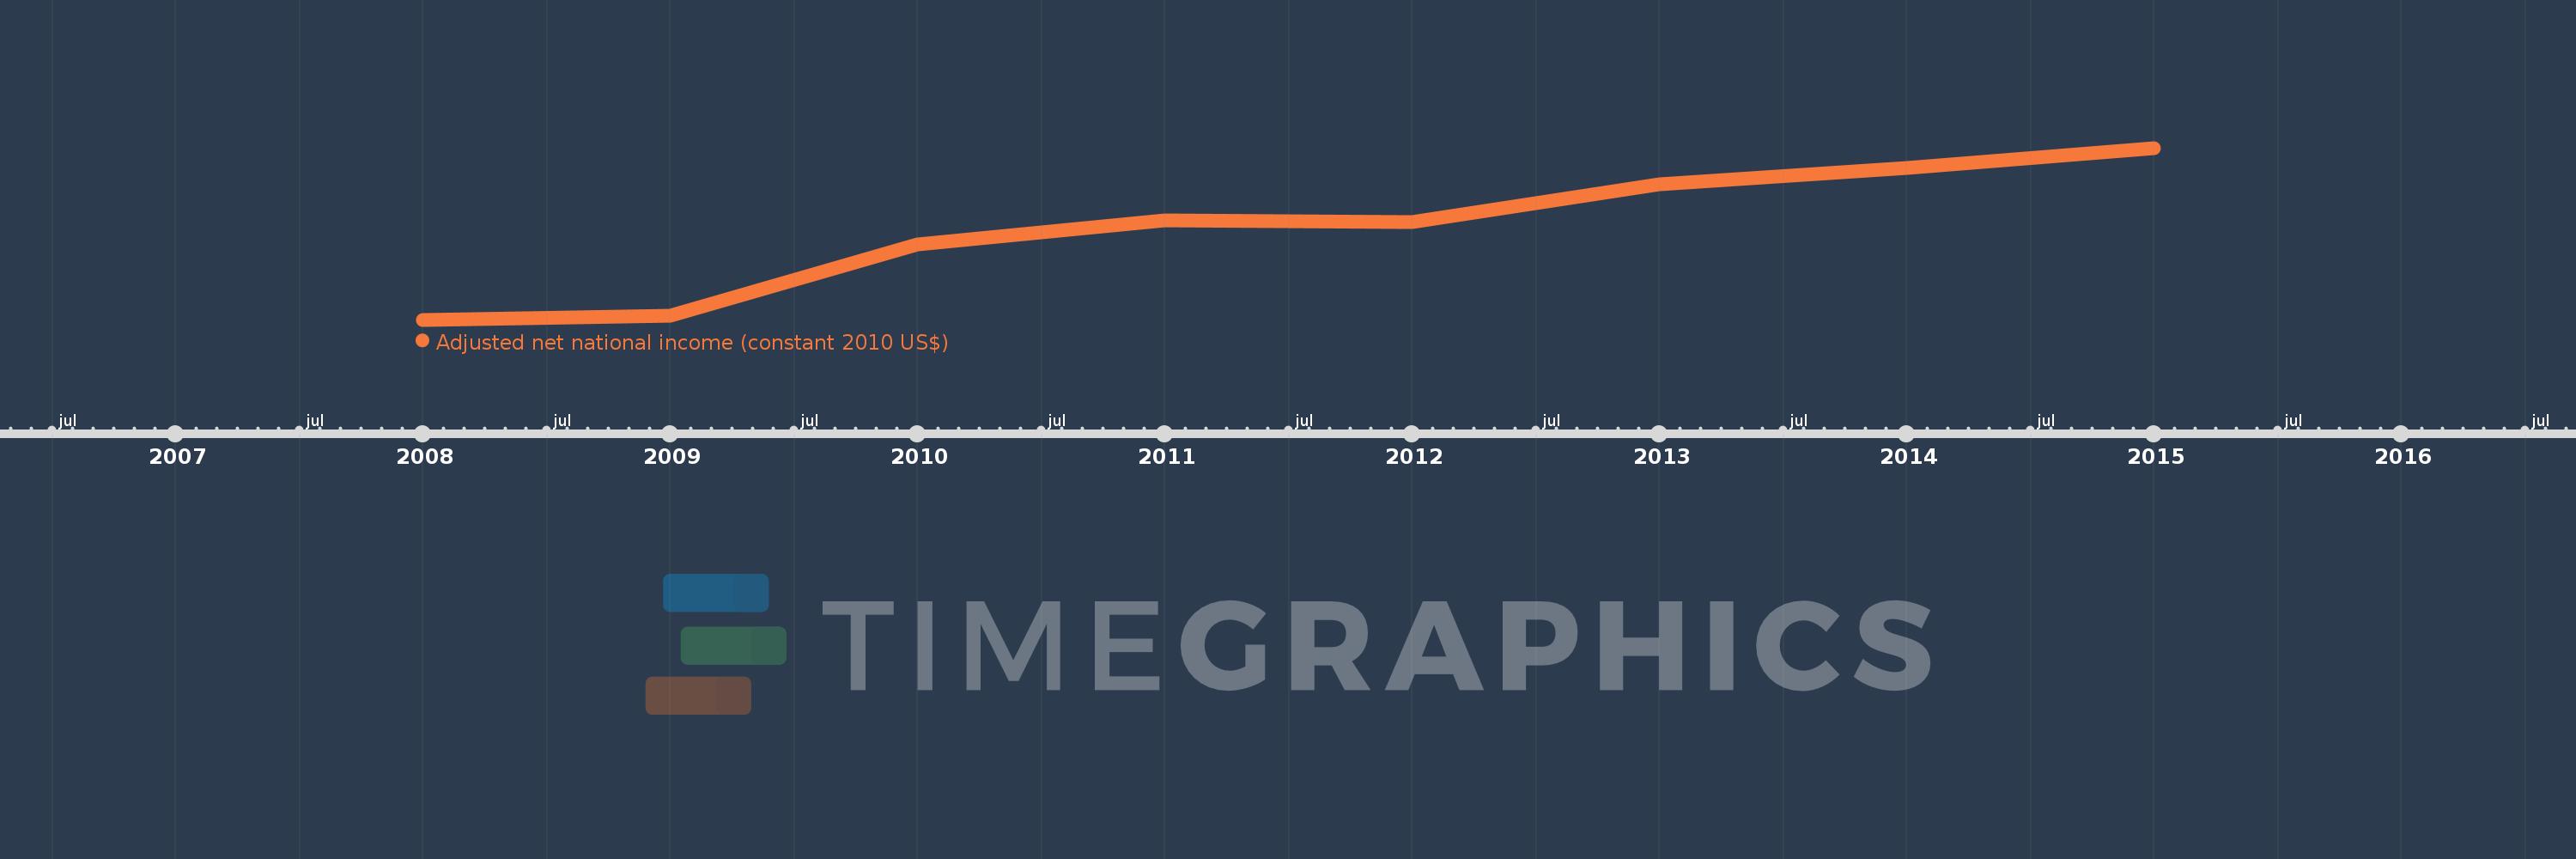
This timeline shows a graph from 2008 to 2015 of Chad. No data until 2007. Number of actual observations by date: 8.
Source name:
World Development Indicators
Source organization:
World Bank staff estimates based on sources and methods in World Bank's "The Changing Wealth of Nations: Measuring Sustainable Development in the New Millennium" (2011).
Categories, topics:
Economy & Growth
Last updated:
apr 23, 2017
Indicators value changes by year
Meaning:
7.541 bln
Minimum:
4.625 bln
jan 1, 2008
Maximum:
10.079 bln
jan 1, 2015
At the date of observation
Value
Absolute change
Change from the previous value
jan 1, 2008
4.625 bln
+4.625 bln
0.0%
jan 1, 2009
4.753 bln
+127.465 mln
2.76%
jan 1, 2010
7.017 bln
+2.264 bln
47.64%
jan 1, 2011
7.768 bln
+751.587 mln
10.71%
jan 1, 2012
7.721 bln
-46.968 mln
-0.6%
jan 1, 2013
8.934 bln
+1.213 bln
15.71%
jan 1, 2014
9.434 bln
+500.329 mln
5.6%
jan 1, 2015
10.079 bln
+644.929 mln
6.84%
Ranking of countries by current statistics by years