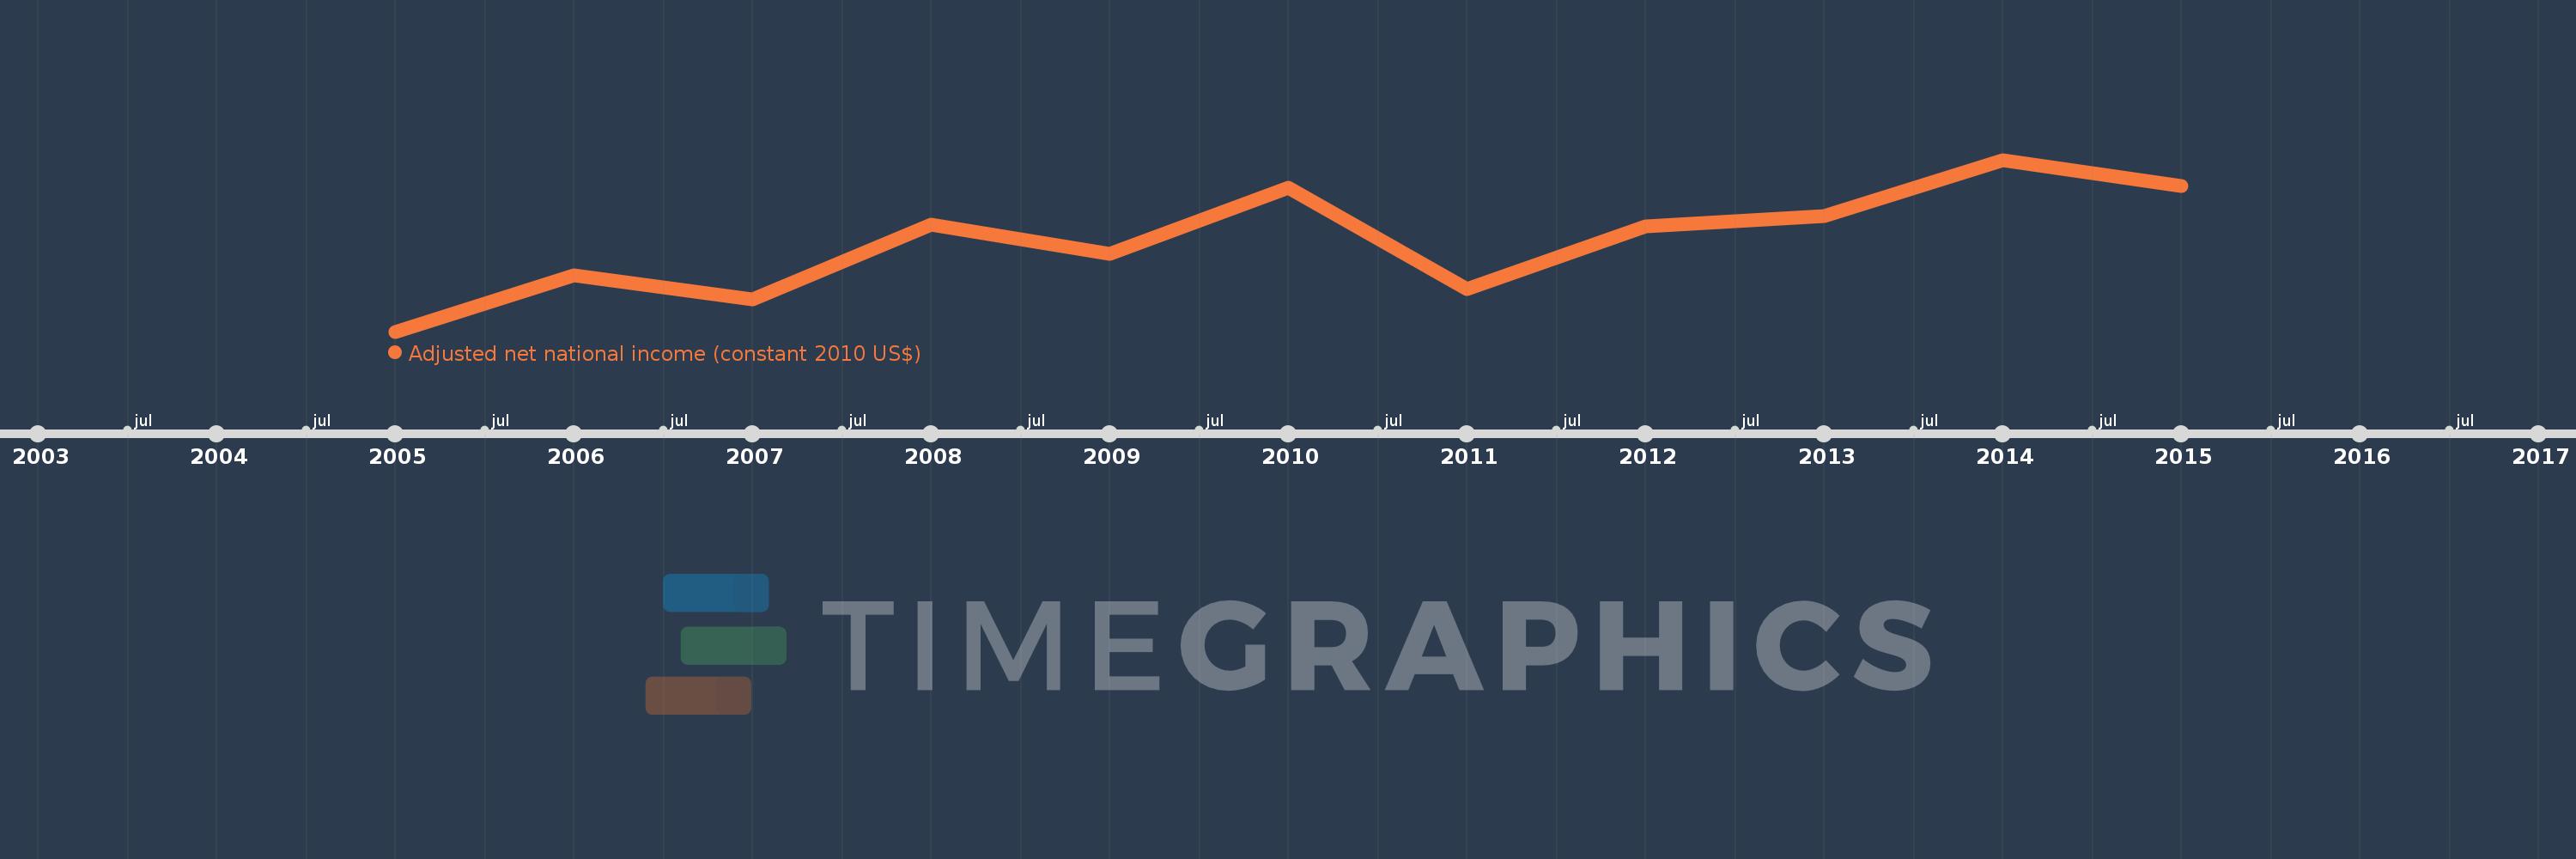
This timeline shows a graph from 2005 to 2015 of Haiti. No data until 2004. Number of actual observations by date: 11.
Source name:
World Development Indicators
Source organization:
World Bank staff estimates based on sources and methods in World Bank's "The Changing Wealth of Nations: Measuring Sustainable Development in the New Millennium" (2011).
Categories, topics:
Economy & Growth
Last updated:
apr 23, 2017
Indicators value changes by year
Meaning:
6.485 bln
Minimum:
6.002 bln
jan 1, 2005
Maximum:
6.917 bln
jan 1, 2014
At the date of observation
Value
Absolute change
Change from the previous value
jan 1, 2005
6.002 bln
+6.002 bln
0.0%
jan 1, 2006
6.301 bln
+299.198 mln
4.98%
jan 1, 2007
6.172 bln
-129.005 mln
-2.05%
jan 1, 2008
6.571 bln
+398.448 mln
6.46%
jan 1, 2009
6.417 bln
-154.288 mln
-2.35%
jan 1, 2010
6.77 bln
+353.285 mln
5.51%
jan 1, 2011
6.226 bln
-543.566 mln
-8.03%
jan 1, 2012
6.564 bln
+337.491 mln
5.42%
jan 1, 2013
6.618 bln
+54.46 mln
0.83%
jan 1, 2014
6.917 bln
+298.426 mln
4.51%
jan 1, 2015
6.778 bln
-138.914 mln
-2.01%
Ranking of countries by current statistics by years