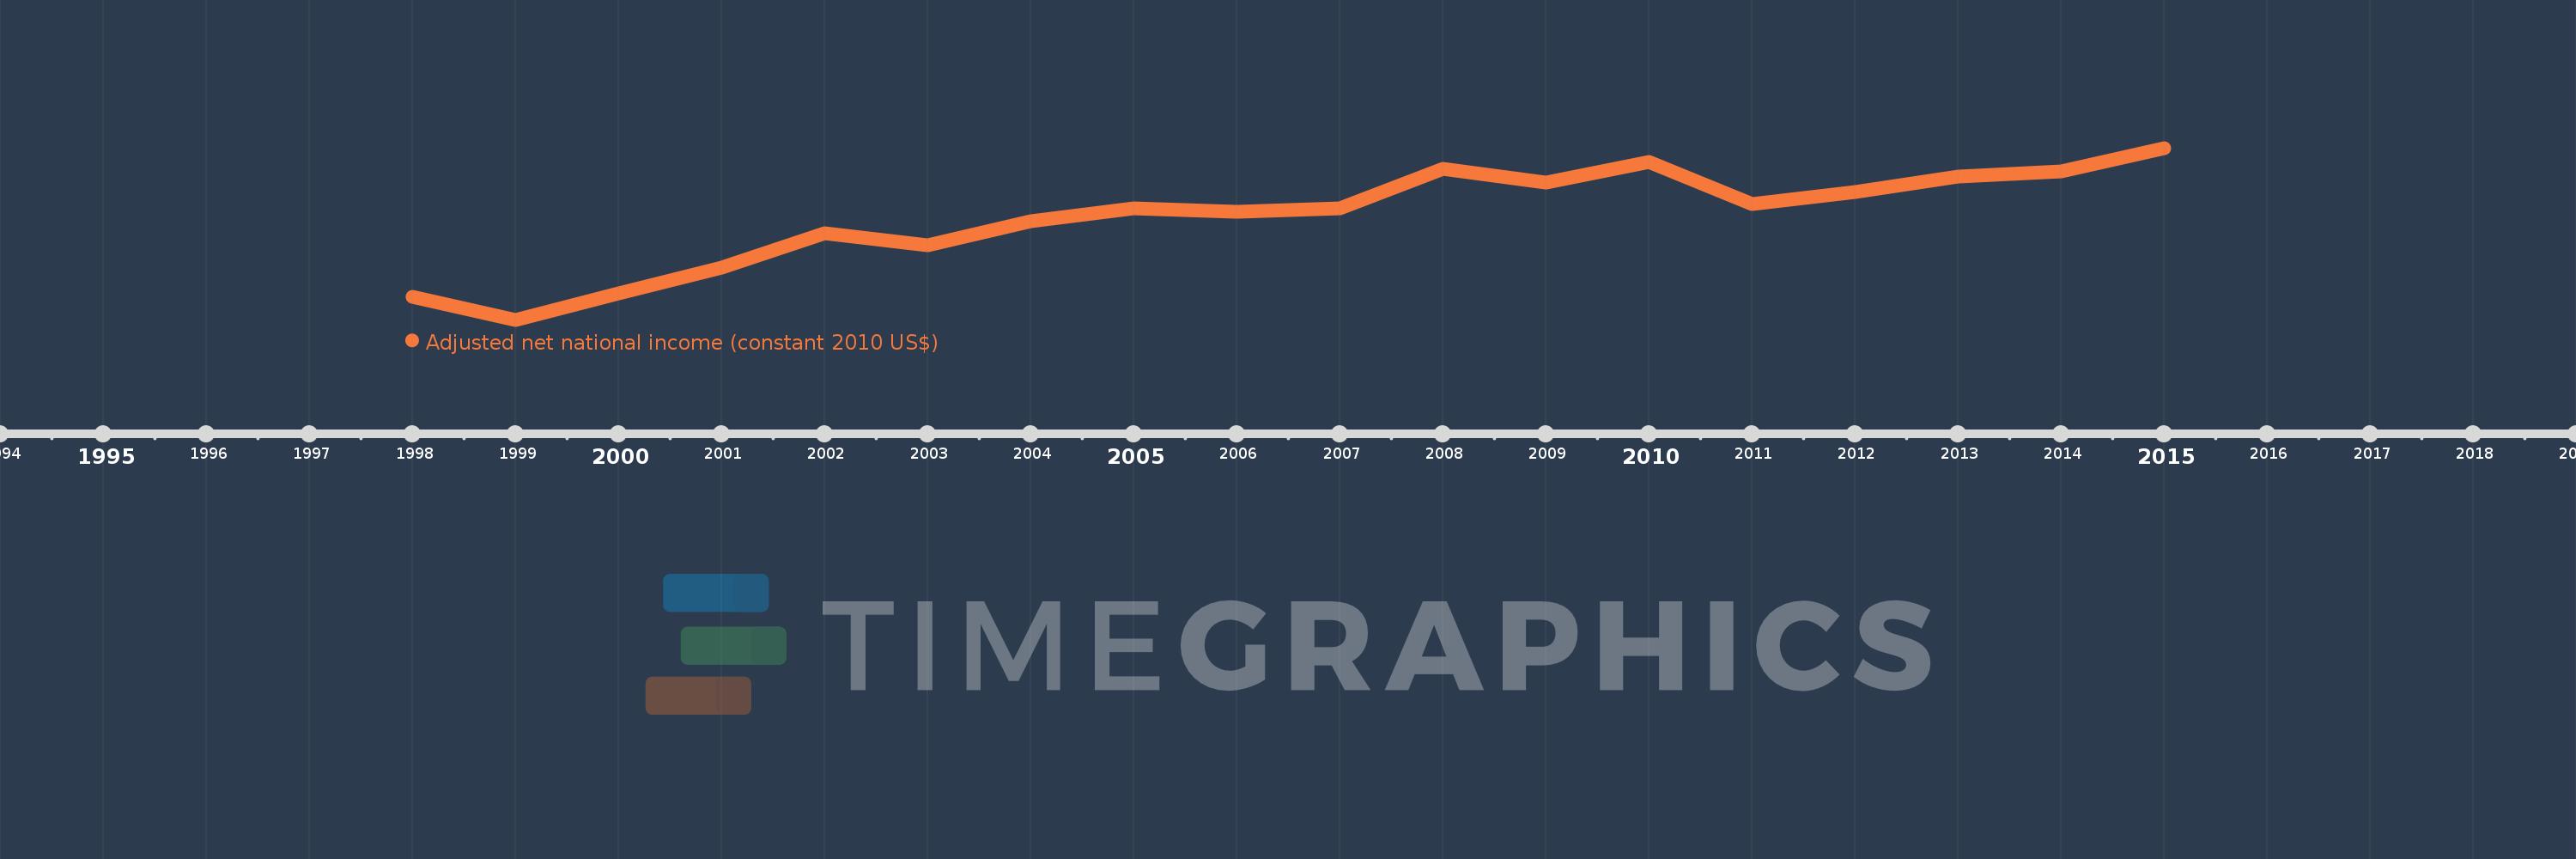
This timeline shows a graph from 1998 to 2015 of Kyrgyz Republic. No data until 1997. Number of actual observations by date: 18.
Source name:
World Development Indicators
Source organization:
World Bank staff estimates based on sources and methods in World Bank's "The Changing Wealth of Nations: Measuring Sustainable Development in the New Millennium" (2011).
Categories, topics:
Economy & Growth
Last updated:
apr 23, 2017
Indicators value changes by year
Meaning:
3.45 bln
Minimum:
2.353 bln
jan 1, 1999
Maximum:
4.194 bln
jan 1, 2015
At the date of observation
Value
Absolute change
Change from the previous value
jan 1, 1998
2.595 bln
+2.595 bln
0.0%
jan 1, 1999
2.353 bln
-242.117 mln
-9.33%
jan 1, 2000
2.632 bln
+279.116 mln
11.86%
jan 1, 2001
2.915 bln
+282.3 mln
10.72%
jan 1, 2002
3.276 bln
+361.741 mln
12.41%
jan 1, 2003
3.149 bln
-127.196 mln
-3.88%
jan 1, 2004
3.406 bln
+257.243 mln
8.17%
jan 1, 2005
3.546 bln
+140.086 mln
4.11%
jan 1, 2006
3.512 bln
-34.564 mln
-0.97%
jan 1, 2007
3.545 bln
+32.88 mln
0.94%
jan 1, 2008
3.972 bln
+426.942 mln
12.04%
jan 1, 2009
3.819 bln
-152.655 mln
-3.84%
jan 1, 2010
4.04 bln
+221.238 mln
5.79%
jan 1, 2011
3.595 bln
-445.71 mln
-11.03%
jan 1, 2012
3.719 bln
+124.812 mln
3.47%
jan 1, 2013
3.888 bln
+168.104 mln
4.52%
jan 1, 2014
3.941 bln
+53.761 mln
1.38%
jan 1, 2015
4.194 bln
+252.921 mln
6.42%
Ranking of countries by current statistics by years