33
/
AIzaSyAYiBZKx7MnpbEhh9jyipgxe19OcubqV5w
August 1, 2025
220391
Paraguay
PRY
true
2
1
Adjusted net national income (constant 2010 US$)
2015,2014,2013,2012,2011,2010,2009,2008,2007,2006,2005,2004,2003,2002,2001,2000,1999,1998,1997,1996
Download
Global statistics library →Paraguay →

Adjusted net national income (constant 2010 US$)

This statistics in other country:

AfghanistanAlbaniaAlgeriaAngolaArab WorldArgentinaArmeniaAustraliaAustriaAzerbaijanBahamas, TheBahrainBangladeshBarbadosBelarusBelgiumBelizeBeninBhutanBoliviaBotswanaBrazilBulgariaBurkina FasoBurundiCabo VerdeCambodiaCameroonCanadaCaribbean small statesCentral African RepublicCentral Europe and the BalticsChadChileChinaColombiaComorosCongo, Dem. Rep.Congo, Rep.Costa RicaCote d'IvoireCroatiaCubaCyprusCzech RepublicDenmarkDominicaDominican RepublicEarly-demographic dividendEast Asia & PacificEast Asia & Pacific (excluding high income)East Asia & Pacific (IDA & IBRD countries)EcuadorEgypt, Arab Rep.El SalvadorEritreaEstoniaEthiopiaEuro areaEurope & Central AsiaEurope & Central Asia (excluding high income)Europe & Central Asia (IDA & IBRD countries)European UnionFijiFinlandFragile and conflict affected situationsFranceGabonGambia, TheGeorgiaGermanyGhanaGreeceGuatemalaGuineaGuinea-BissauGuyanaHaitiHeavily indebted poor countries (HIPC)High incomeHondurasHungaryIBRD onlyIDA & IBRD totalIDA blendIDA onlyIDA totalIndiaIndonesiaIran, Islamic Rep.IraqIrelandIsraelItalyJamaicaJapanJordanKazakhstanKenyaKiribatiKorea, Rep.KuwaitKyrgyz RepublicLao PDRLate-demographic dividendLatin America & Caribbean Latin America & Caribbean (excluding high income)Latin America & the Caribbean (IDA & IBRD countries)LatviaLeast developed countries: UN classificationLebanonLesothoLiberiaLibyaLithuaniaLow & middle incomeLow incomeLower middle incomeLuxembourgMacedonia, FYRMadagascarMalawiMalaysiaMaldivesMaliMauritaniaMauritiusMexicoMiddle East & North AfricaMiddle East & North Africa (excluding high income)Middle East & North Africa (IDA & IBRD countries)Middle incomeMoldovaMongoliaMoroccoMozambiqueNamibiaNepalNetherlandsNew ZealandNicaraguaNigerNigeriaNorth AmericaNorwayOECD membersOmanOther small statesPacific island small statesPakistanPanamaPapua New GuineaParaguayPeruPhilippinesPolandPortugalPost-demographic dividendPre-demographic dividendQatarRomaniaRussian FederationRwandaSamoaSao Tome and PrincipeSaudi ArabiaSenegalSeychellesSierra LeoneSingaporeSlovak RepublicSloveniaSmall statesSolomon IslandsSouth AfricaSouth AsiaSouth Asia (IDA & IBRD)SpainSri LankaSt. LuciaSt. Vincent and the GrenadinesSub-Saharan Africa Sub-Saharan Africa (excluding high income)Sub-Saharan Africa (IDA & IBRD countries)SurinameSwazilandSwedenSwitzerlandTajikistanTanzaniaThailandTogoTongaTrinidad and TobagoTunisiaTurkeyTurkmenistanUgandaUkraineUnited Arab EmiratesUnited KingdomUnited StatesUpper middle incomeUruguayUzbekistanVanuatuVenezuela, RBVietnamWorldYemen, Rep.ZambiaZimbabwe

Timeline:

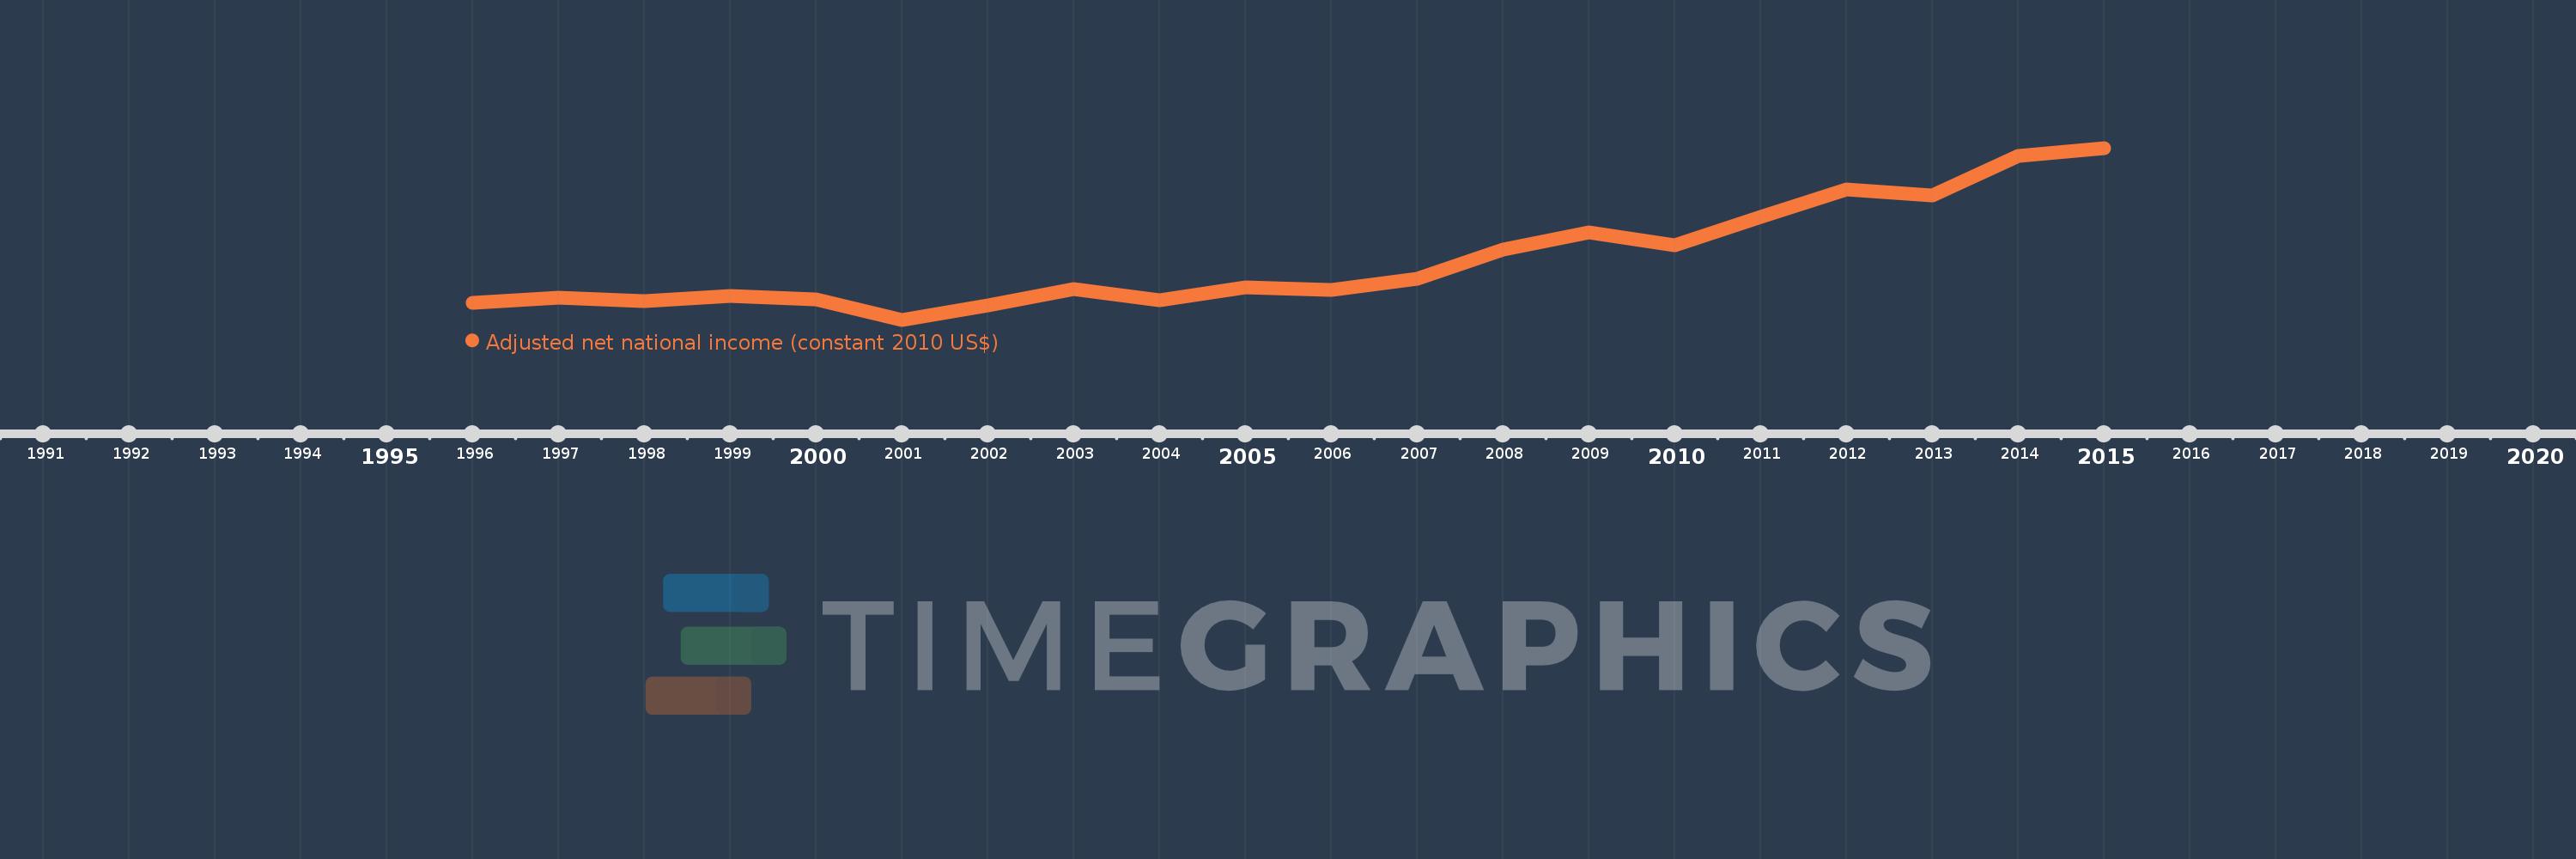
This timeline shows a graph from 1996 to 2015 of Paraguay. No data until 1995. Number of actual observations by date: 20.

Source name:

World Development Indicators

Source organization:

World Bank staff estimates based on sources and methods in World Bank's "The Changing Wealth of Nations: Measuring Sustainable Development in the New Millennium" (2011).

Categories, topics:

Economy & Growth

Last updated:

apr 23, 2017

Indicators value changes by year

Meaning:
13.412 bln
Minimum:
9.874 bln
jan 1, 2001
Maximum:
20.055 bln
jan 1, 2015
At the date of observation
Value
Absolute change
Change from the previous value
jan 1, 1996
10.902 bln
+10.902 bln
0.0%
jan 1, 1997
11.184 bln
+282.934 mln
2.6%
jan 1, 1998
10.964 bln
-220.254 mln
-1.97%
jan 1, 1999
11.271 bln
+307.166 mln
2.8%
jan 1, 2000
11.105 bln
-166.797 mln
-1.48%
jan 1, 2001
9.874 bln
-1.231 bln
-11.08%
jan 1, 2002
10.712 bln
+837.976 mln
8.49%
jan 1, 2003
11.685 bln
+973.088 mln
9.08%
jan 1, 2004
11.038 bln
-646.942 mln
-5.54%
jan 1, 2005
11.79 bln
+752.158 mln
6.81%
jan 1, 2006
11.639 bln
-151.128 mln
-1.28%
jan 1, 2007
12.28 bln
+640.735 mln
5.51%
jan 1, 2008
14.03 bln
+1.75 bln
14.25%
jan 1, 2009
15.031 bln
+1.001 bln
7.13%
jan 1, 2010
14.287 bln
-743.303 mln
-4.95%
jan 1, 2011
15.945 bln
+1.657 bln
11.6%
jan 1, 2012
17.615 bln
+1.67 bln
10.48%
jan 1, 2013
17.232 bln
-383.41 mln
-2.18%
jan 1, 2014
19.594 bln
+2.362 bln
13.71%
jan 1, 2015
20.055 bln
+460.729 mln
2.35%

Ranking of countries by current statistics by years