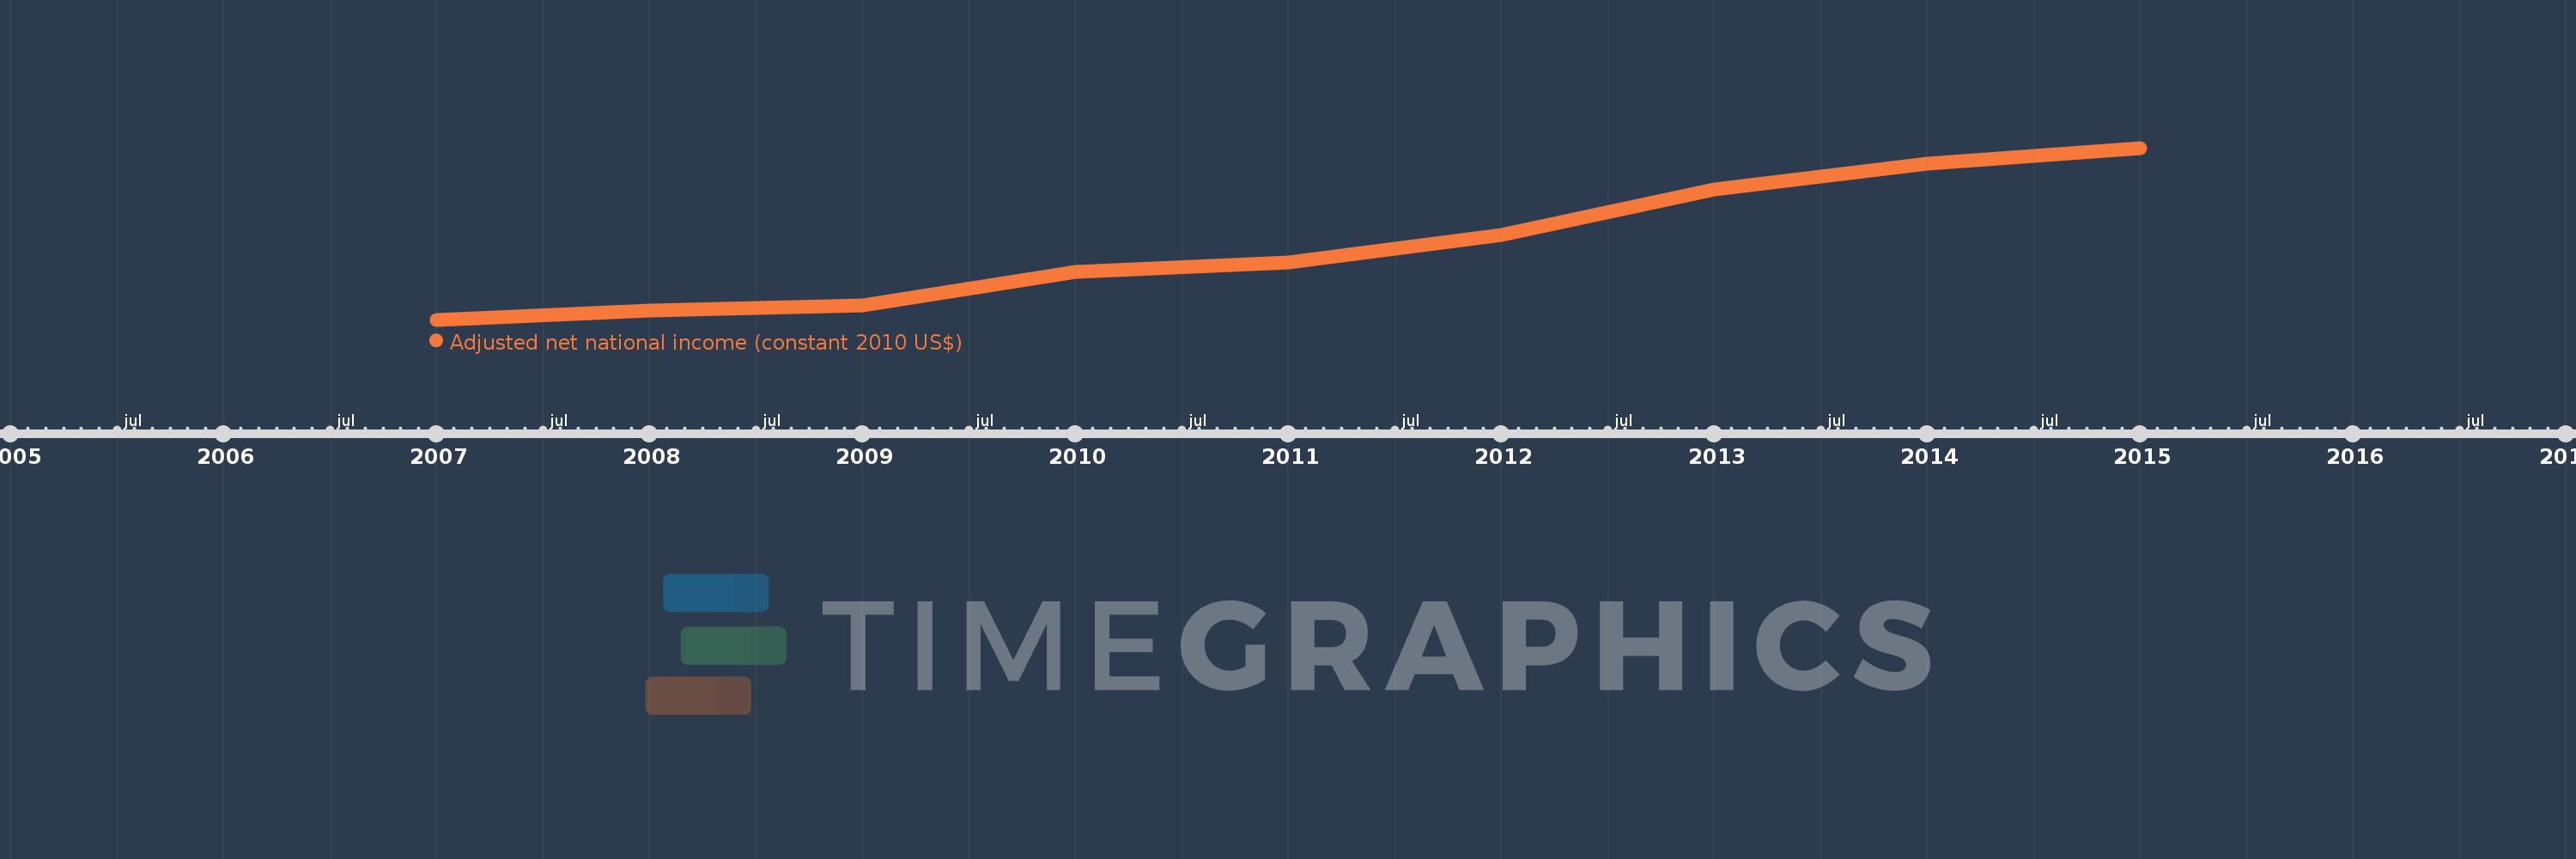
This timeline shows a graph from 2007 to 2015 of Suriname. No data until 2006. Number of actual observations by date: 9.
Source name:
World Development Indicators
Source organization:
World Bank staff estimates based on sources and methods in World Bank's "The Changing Wealth of Nations: Measuring Sustainable Development in the New Millennium" (2011).
Categories, topics:
Economy & Growth
Last updated:
apr 23, 2017
Indicators value changes by year
Meaning:
3.151 bln
Minimum:
2.629 bln
jan 1, 2007
Maximum:
3.833 bln
jan 1, 2015
At the date of observation
Value
Absolute change
Change from the previous value
jan 1, 2007
2.629 bln
+2.629 bln
0.0%
jan 1, 2008
2.696 bln
+66.613 mln
2.53%
jan 1, 2009
2.728 bln
+31.737 mln
1.18%
jan 1, 2010
2.962 bln
+234.287 mln
8.59%
jan 1, 2011
3.028 bln
+65.759 mln
2.22%
jan 1, 2012
3.224 bln
+196.613 mln
6.49%
jan 1, 2013
3.54 bln
+316.067 mln
9.8%
jan 1, 2014
3.72 bln
+179.504 mln
5.07%
jan 1, 2015
3.833 bln
+112.95 mln
3.04%
Ranking of countries by current statistics by years