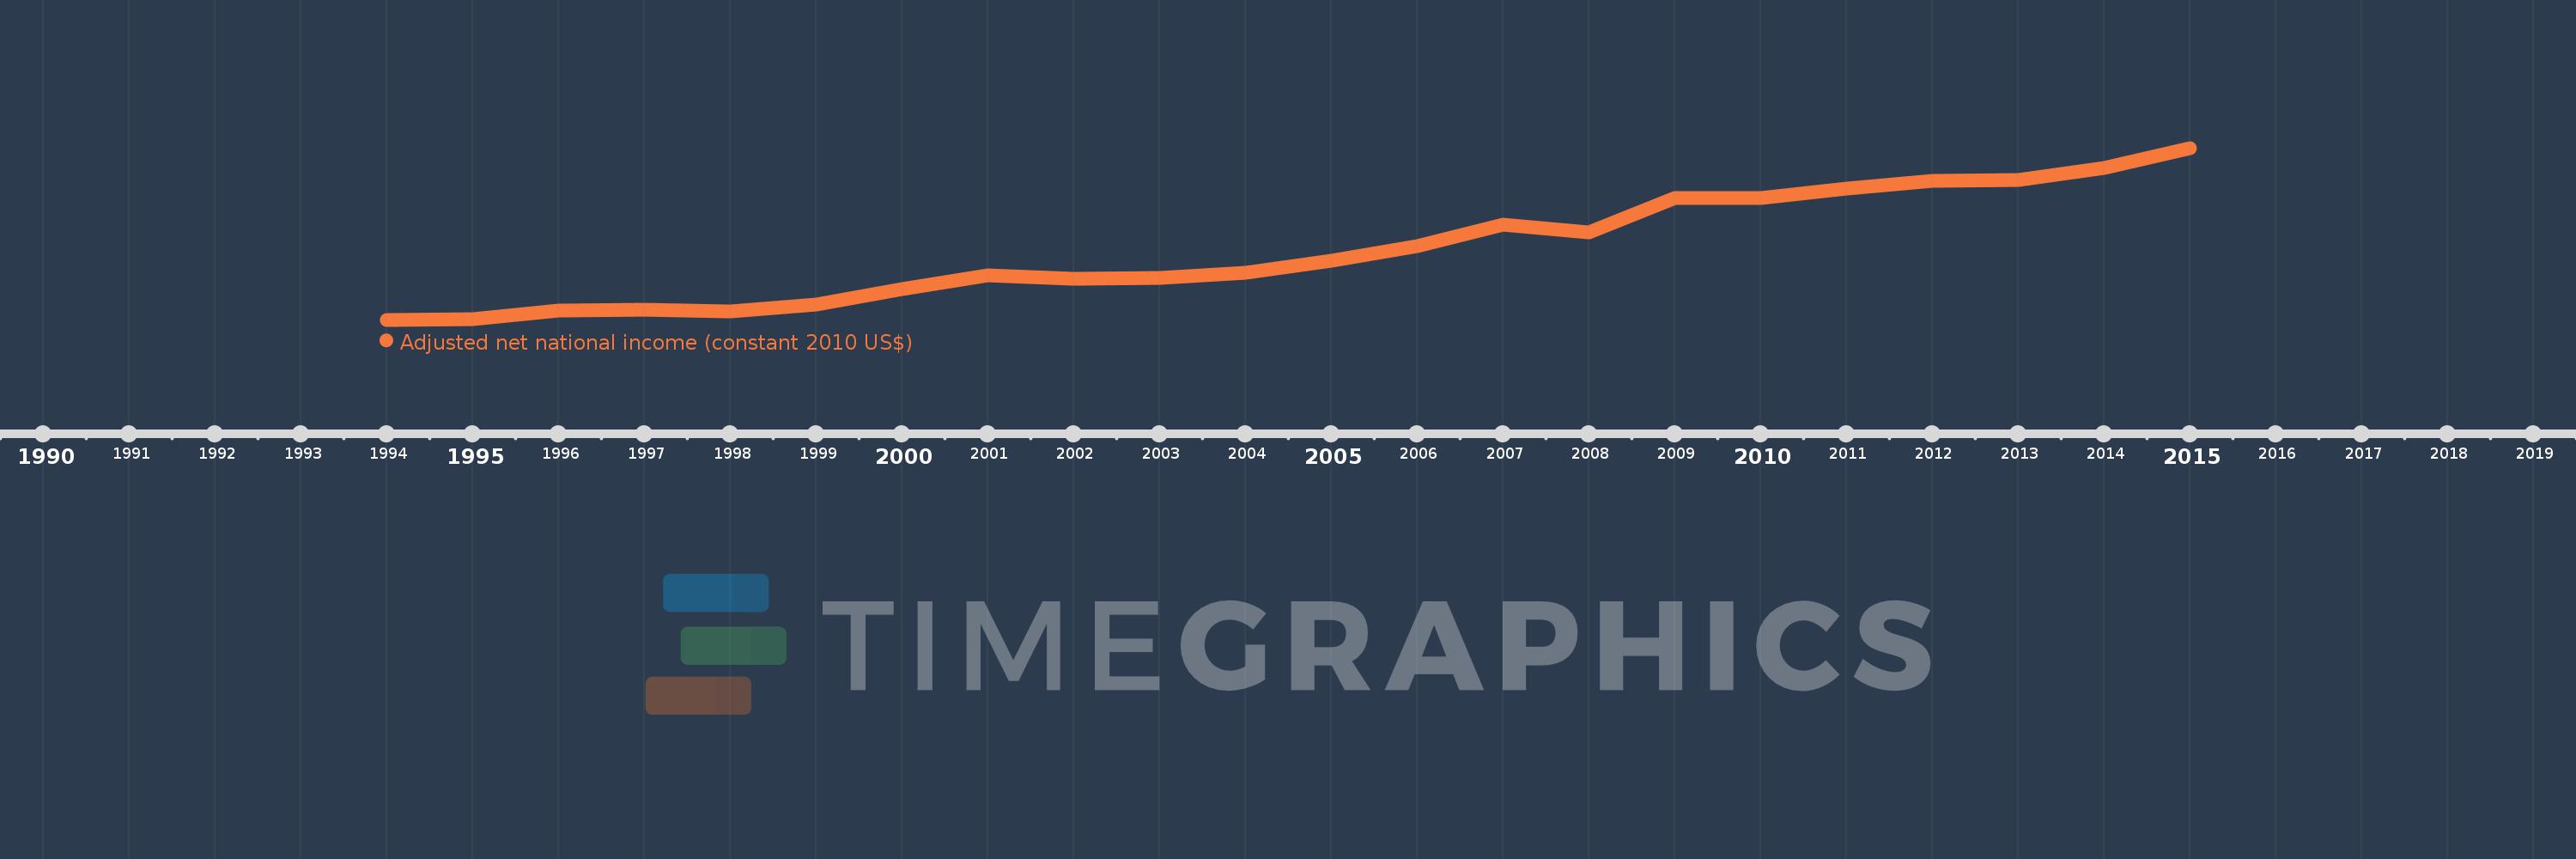
This timeline shows a graph from 1994 to 2015 of Macedonia, FYR. No data until 1993. Number of actual observations by date: 22.
Source name:
World Development Indicators
Source organization:
World Bank staff estimates based on sources and methods in World Bank's "The Changing Wealth of Nations: Measuring Sustainable Development in the New Millennium" (2011).
Categories, topics:
Economy & Growth
Last updated:
apr 23, 2017
Indicators value changes by year
Meaning:
6.178 bln
Minimum:
4.753 bln
jan 1, 1994
Maximum:
8.247 bln
jan 1, 2015
At the date of observation
Value
Absolute change
Change from the previous value
jan 1, 1994
4.753 bln
+4.753 bln
0.0%
jan 1, 1995
4.773 bln
+20.046 mln
0.42%
jan 1, 1996
4.944 bln
+170.71 mln
3.58%
jan 1, 1997
4.961 bln
+17.335 mln
0.35%
jan 1, 1998
4.919 bln
-41.977 mln
-0.85%
jan 1, 1999
5.062 bln
+143.102 mln
2.91%
jan 1, 2000
5.375 bln
+313.431 mln
6.19%
jan 1, 2001
5.662 bln
+286.846 mln
5.34%
jan 1, 2002
5.585 bln
-77.71 mln
-1.37%
jan 1, 2003
5.606 bln
+21.226 mln
0.38%
jan 1, 2004
5.705 bln
+99.144 mln
1.77%
jan 1, 2005
5.945 bln
+240.458 mln
4.21%
jan 1, 2006
6.255 bln
+309.888 mln
5.21%
jan 1, 2007
6.679 bln
+423.58 mln
6.77%
jan 1, 2008
6.524 bln
-154.781 mln
-2.32%
jan 1, 2009
7.233 bln
+709.265 mln
10.87%
jan 1, 2010
7.234 bln
+402.771K
0.01%
jan 1, 2011
7.428 bln
+193.8 mln
2.68%
jan 1, 2012
7.582 bln
+154.659 mln
2.08%
jan 1, 2013
7.602 bln
+19.477 mln
0.26%
jan 1, 2014
7.848 bln
+246.02 mln
3.24%
jan 1, 2015
8.247 bln
+399.514 mln
5.09%
Ranking of countries by current statistics by years