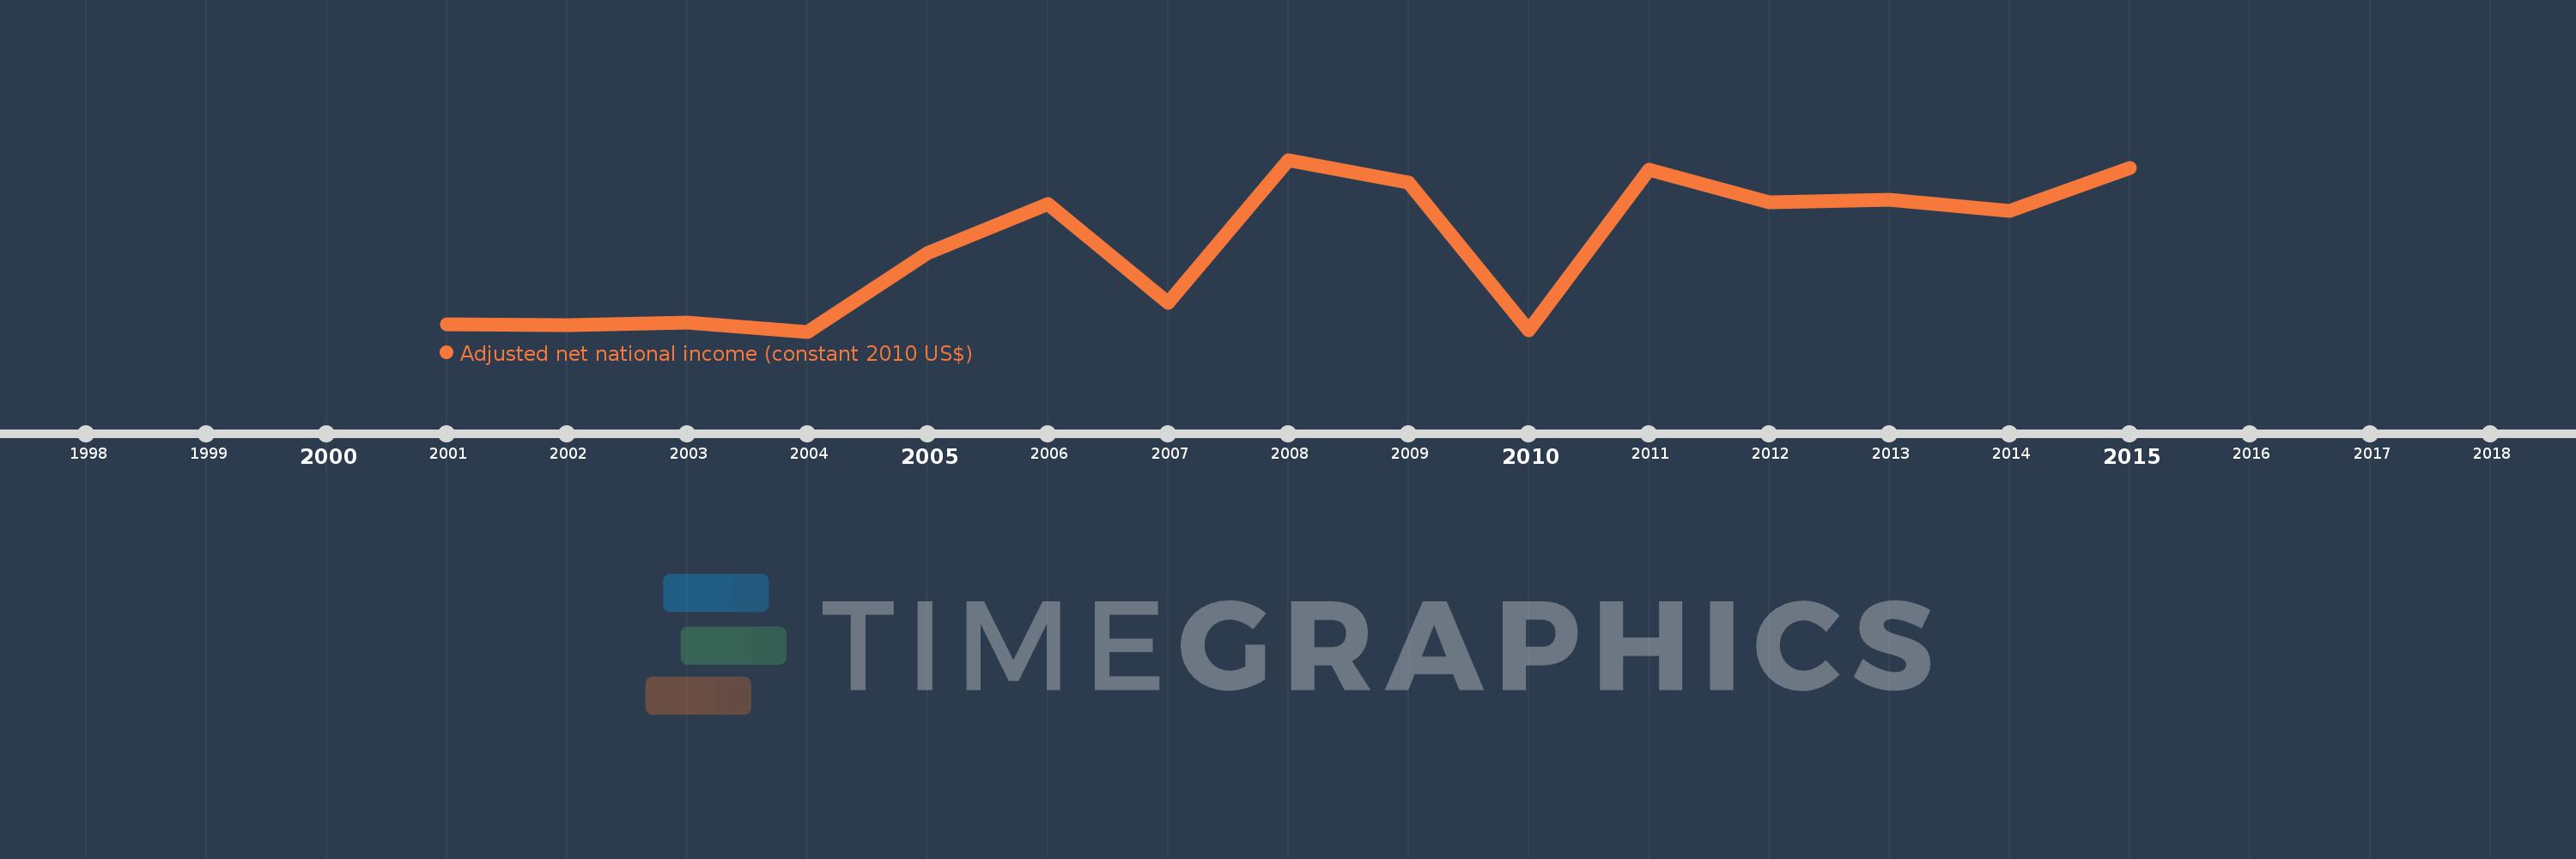
This timeline shows a graph from 2001 to 2015 of Luxembourg. No data until 2000. Number of actual observations by date: 15.
Source name:
World Development Indicators
Source organization:
World Bank staff estimates based on sources and methods in World Bank's "The Changing Wealth of Nations: Measuring Sustainable Development in the New Millennium" (2011).
Categories, topics:
Economy & Growth
Last updated:
apr 23, 2017
Indicators value changes by year
Meaning:
29.242 bln
Minimum:
26.021 bln
jan 1, 2004
Maximum:
32.464 bln
jan 1, 2008
At the date of observation
Value
Absolute change
Change from the previous value
jan 1, 2001
26.294 bln
+26.294 bln
0.0%
jan 1, 2002
26.268 bln
-25.205 mln
-0.1%
jan 1, 2003
26.361 bln
+92.223 mln
0.35%
jan 1, 2004
26.021 bln
-340.115 mln
-1.29%
jan 1, 2005
28.973 bln
+2.952 bln
11.34%
jan 1, 2006
30.814 bln
+1.842 bln
6.36%
jan 1, 2007
27.103 bln
-3.711 bln
-12.04%
jan 1, 2008
32.464 bln
+5.361 bln
19.78%
jan 1, 2009
31.607 bln
-857.286 mln
-2.64%
jan 1, 2010
26.065 bln
-5.542 bln
-17.53%
jan 1, 2011
32.107 bln
+6.043 bln
23.18%
jan 1, 2012
30.885 bln
-1.222 bln
-3.81%
jan 1, 2013
30.958 bln
+72.822 mln
0.24%
jan 1, 2014
30.539 bln
-419.435 mln
-1.35%
jan 1, 2015
32.171 bln
+1.632 bln
5.34%
Ranking of countries by current statistics by years