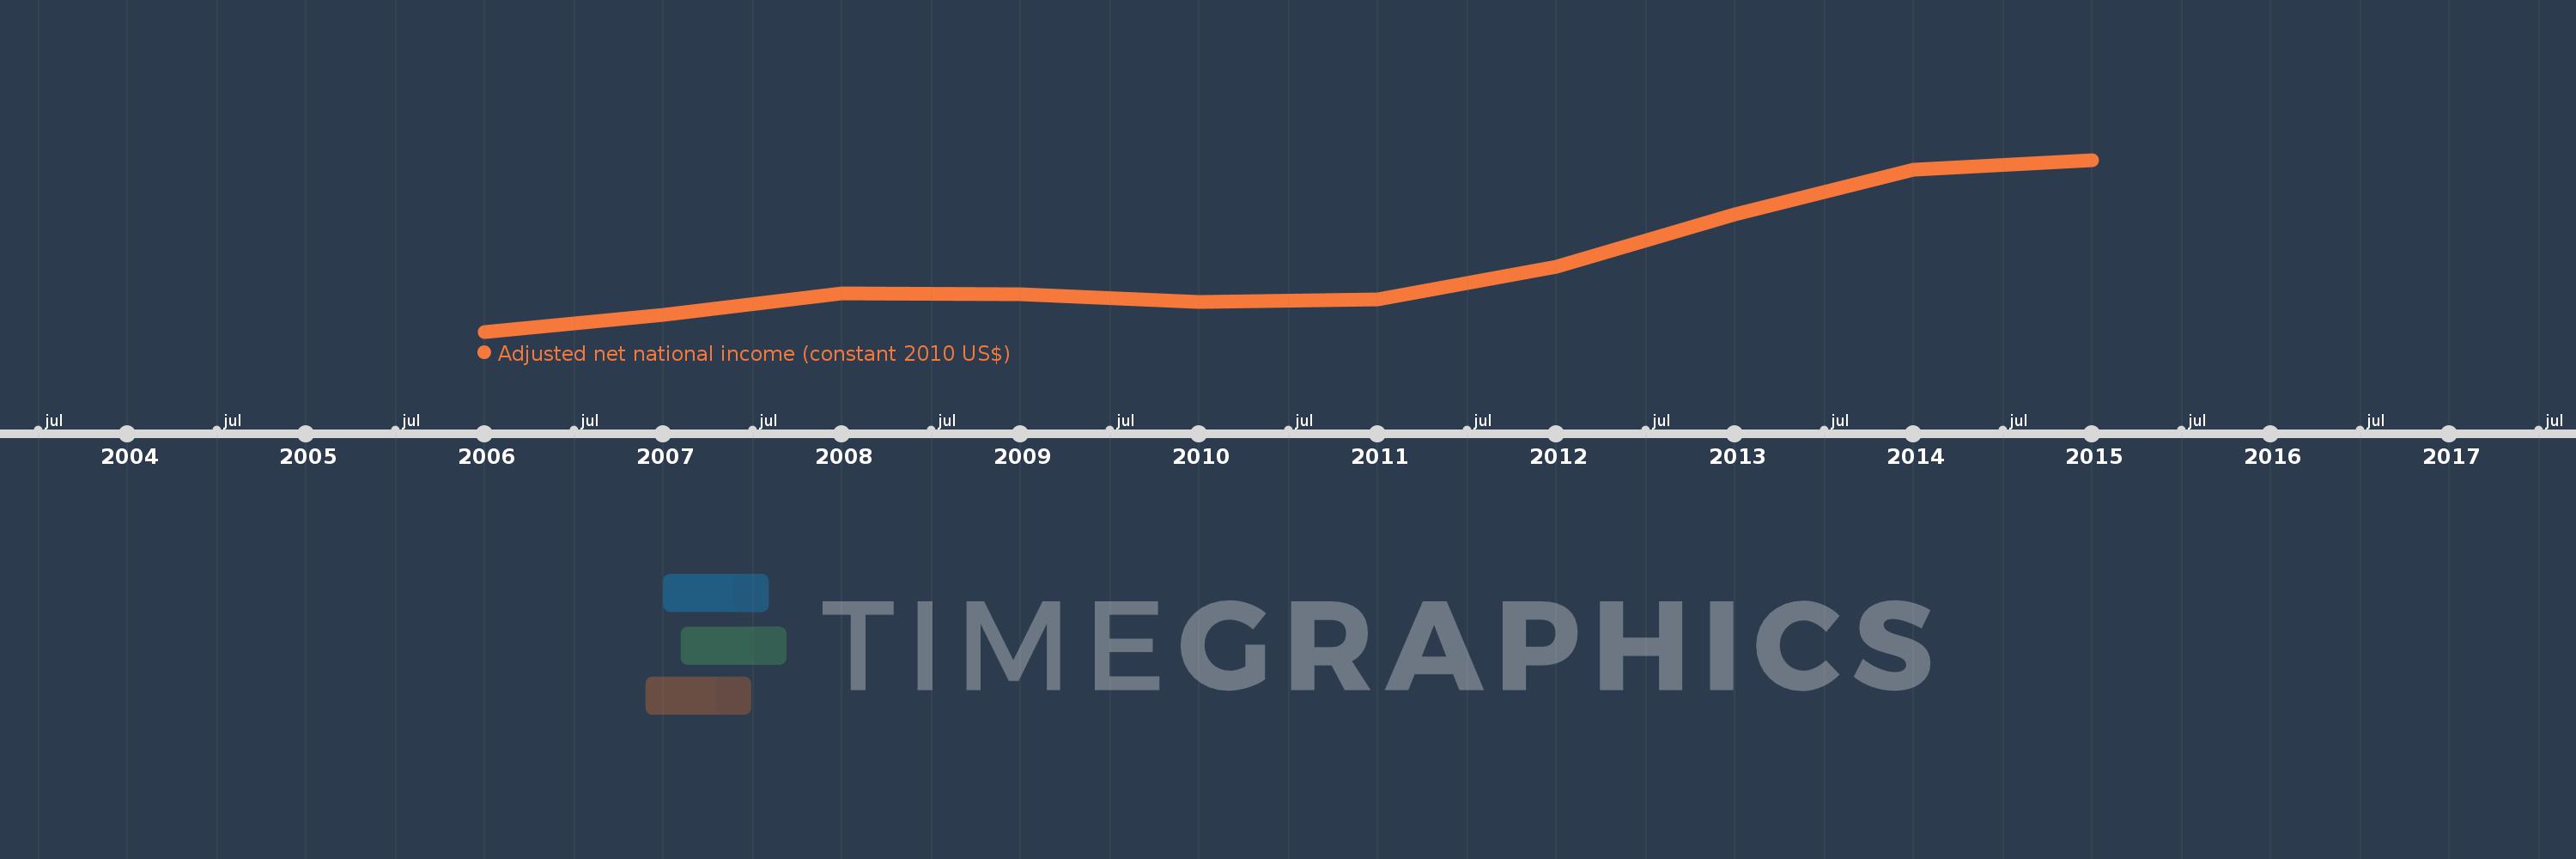
This timeline shows a graph from 2006 to 2015 of Mongolia. No data until 2005. Number of actual observations by date: 10.
Source name:
World Development Indicators
Source organization:
World Bank staff estimates based on sources and methods in World Bank's "The Changing Wealth of Nations: Measuring Sustainable Development in the New Millennium" (2011).
Categories, topics:
Economy & Growth
Last updated:
apr 23, 2017
Indicators value changes by year
Meaning:
5.786 bln
Minimum:
3.986 bln
jan 1, 2006
Maximum:
8.605 bln
jan 1, 2015
At the date of observation
Value
Absolute change
Change from the previous value
jan 1, 2006
3.986 bln
+3.986 bln
0.0%
jan 1, 2007
4.432 bln
+445.849 mln
11.18%
jan 1, 2008
5.02 bln
+587.874 mln
13.26%
jan 1, 2009
4.991 bln
-28.926 mln
-0.58%
jan 1, 2010
4.773 bln
-217.651 mln
-4.36%
jan 1, 2011
4.846 bln
+72.767 mln
1.52%
jan 1, 2012
5.724 bln
+877.601 mln
18.11%
jan 1, 2013
7.136 bln
+1.412 bln
24.67%
jan 1, 2014
8.347 bln
+1.211 bln
16.97%
jan 1, 2015
8.605 bln
+258.073 mln
3.09%
Ranking of countries by current statistics by years