29
/
en
AIzaSyAYiBZKx7MnpbEhh9jyipgxe19OcubqV5w
April 1, 2024
90722
Brazil
BRA
true
2
1
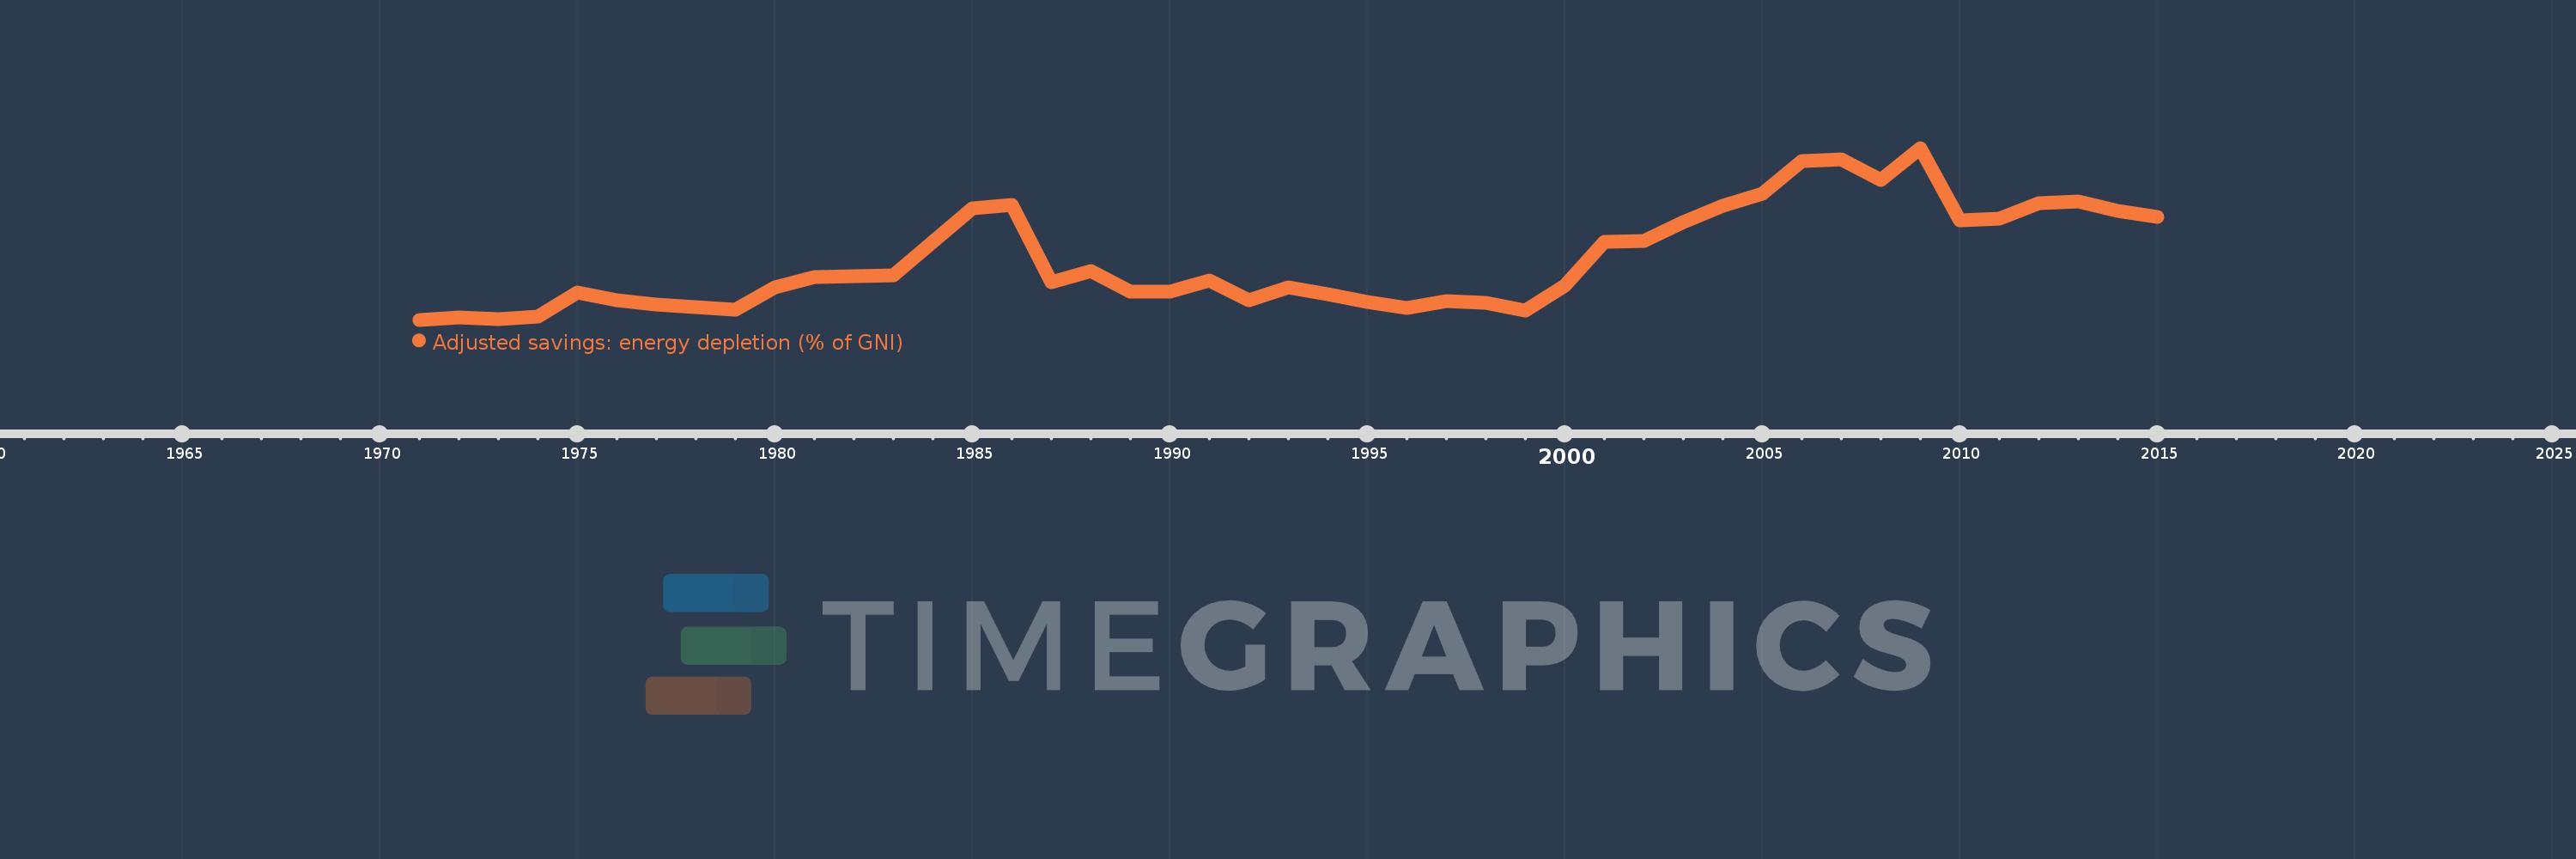
Adjusted savings: energy depletion (% of GNI)
2015,2014,2013,2012,2011,2010,2009,2008,2007,2006,2005,2004,2003,2002,2001,2000,1999,1998,1997,1996,1995,1994,1993,1992,1991,1990,1989,1988,1987,1986,1985,1984,1983,1982,1981,1980,1979,1978,1977,1976,1975,1974,1973,1972,1971
This statistics in other country:
AfghanistanAlbaniaAlgeriaAmerican SamoaAndorraAngolaAntigua and BarbudaArab WorldArgentinaArmeniaAustraliaAustriaAzerbaijanBahamas, TheBahrainBangladeshBarbadosBelarusBelgiumBelizeBeninBermudaBhutanBoliviaBosnia and HerzegovinaBotswanaBrazilBrunei DarussalamBulgariaBurkina FasoBurundiCabo VerdeCambodiaCameroonCanadaCaribbean small statesCentral African RepublicCentral Europe and the BalticsChadChannel IslandsChileChinaColombiaComorosCongo, Dem. Rep.Congo, Rep.Costa RicaCote d'IvoireCroatiaCubaCyprusCzech RepublicDenmarkDjiboutiDominicaDominican RepublicEarly-demographic dividendEast Asia & PacificEast Asia & Pacific (excluding high income)East Asia & Pacific (IDA & IBRD countries)EcuadorEgypt, Arab Rep.El SalvadorEquatorial GuineaEritreaEstoniaEthiopiaEuro areaEurope & Central AsiaEurope & Central Asia (excluding high income)Europe & Central Asia (IDA & IBRD countries)European UnionFaroe IslandsFijiFinlandFragile and conflict affected situationsFranceFrench PolynesiaGabonGambia, TheGeorgiaGermanyGhanaGreeceGreenlandGrenadaGuatemalaGuineaGuinea-BissauGuyanaHaitiHeavily indebted poor countries (HIPC)High incomeHondurasHong Kong SAR, ChinaHungaryIBRD onlyIcelandIDA & IBRD totalIDA blendIDA onlyIDA totalIndiaIndonesiaIran, Islamic Rep.IraqIrelandIsle of ManIsraelItalyJamaicaJapanJordanKazakhstanKenyaKiribatiKorea, Rep.KosovoKuwaitKyrgyz RepublicLao PDRLate-demographic dividendLatin America & Caribbean Latin America & Caribbean (excluding high income)Latin America & the Caribbean (IDA & IBRD countries)LatviaLeast developed countries: UN classificationLebanonLesothoLiberiaLibyaLiechtensteinLithuaniaLow & middle incomeLow incomeLower middle incomeLuxembourgMacao SAR, ChinaMacedonia, FYRMadagascarMalawiMalaysiaMaldivesMaliMaltaMarshall IslandsMauritaniaMauritiusMexicoMicronesia, Fed. Sts.Middle East & North AfricaMiddle East & North Africa (excluding high income)Middle East & North Africa (IDA & IBRD countries)Middle incomeMoldovaMonacoMongoliaMontenegroMoroccoMozambiqueMyanmarNamibiaNepalNetherlandsNew CaledoniaNew ZealandNicaraguaNigerNigeriaNorth AmericaNorwayOECD membersOmanOther small statesPacific island small statesPakistanPalauPanamaPapua New GuineaParaguayPeruPhilippinesPolandPortugalPost-demographic dividendPre-demographic dividendPuerto RicoQatarRomaniaRussian FederationRwandaSamoaSan MarinoSao Tome and PrincipeSaudi ArabiaSenegalSerbiaSeychellesSierra LeoneSingaporeSlovak RepublicSloveniaSmall statesSolomon IslandsSomaliaSouth AfricaSouth AsiaSouth Asia (IDA & IBRD)South SudanSpainSri LankaSt. Kitts and NevisSt. LuciaSt. Vincent and the GrenadinesSub-Saharan Africa Sub-Saharan Africa (excluding high income)Sub-Saharan Africa (IDA & IBRD countries)SudanSurinameSwazilandSwedenSwitzerlandSyrian Arab RepublicTajikistanTanzaniaThailandTimor-LesteTogoTongaTrinidad and TobagoTunisiaTurkeyTurkmenistanTuvaluUgandaUkraineUnited Arab EmiratesUnited KingdomUnited StatesUpper middle incomeUruguayUzbekistanVanuatuVenezuela, RBVietnamVirgin Islands (U.S.)West Bank and GazaWorldYemen, Rep.ZambiaZimbabwe Timeline:
This timeline shows a graph from 1971 to 2015 of Brazil. No data until 1970. Number of actual observations by date: 45.
Source name:
World Development Indicators
Source organization:
World Bank staff estimates based on sources and methods in World Bank's "The Changing Wealth of Nations: Measuring Sustainable Development in the New Millennium" (2011).
Categories, topics:
Economy & Growth, Energy & Mining, Environment
Last updated:
apr 23, 2017
Indicators value changes by year
At the date of observation
Value
Absolute change
Change from previous value
jan 1, 1971
0.12
+0.12
0.0%
jan 1, 1972
0.158
+0.038
31.25%
jan 1, 1973
0.133
-0.025
-15.76%
jan 1, 1974
0.161
+0.028
20.91%
jan 1, 1975
0.514
+0.353
219.76%
jan 1, 1976
0.394
-0.12
-23.35%
jan 1, 1977
0.338
-0.056
-14.25%
jan 1, 1978
0.296
-0.042
-12.29%
jan 1, 1979
0.265
-0.032
-10.7%
jan 1, 1980
0.588
+0.324
122.22%
jan 1, 1981
0.732
+0.144
24.48%
jan 1, 1982
0.739
+0.007
0.96%
jan 1, 1983
0.756
+0.017
2.3%
jan 1, 1984
1.23
+0.474
62.64%
jan 1, 1985
1.706
+0.477
38.75%
jan 1, 1986
1.758
+0.052
3.04%
jan 1, 1987
0.661
-1.097
-62.42%
jan 1, 1988
0.818
+0.157
23.71%
jan 1, 1989
0.523
-0.294
-36.02%
jan 1, 1990
0.519
-0.004
-0.79%
jan 1, 1991
0.678
+0.159
30.72%
jan 1, 1992
0.4
-0.278
-40.99%
jan 1, 1993
0.582
+0.181
45.3%
jan 1, 1994
0.486
-0.096
-16.49%
jan 1, 1995
0.368
-0.117
-24.15%
jan 1, 1996
0.291
-0.077
-20.91%
jan 1, 1997
0.387
+0.096
32.81%
jan 1, 1998
0.366
-0.021
-5.43%
jan 1, 1999
0.255
-0.111
-30.32%
jan 1, 2000
0.611
+0.356
139.6%
jan 1, 2001
1.231
+0.62
101.47%
jan 1, 2002
1.245
+0.015
1.19%
jan 1, 2003
1.517
+0.272
21.84%
jan 1, 2004
1.743
+0.226
14.86%
jan 1, 2005
1.918
+0.175
10.06%
jan 1, 2006
2.383
+0.465
24.23%
jan 1, 2007
2.413
+0.03
1.26%
jan 1, 2008
2.121
-0.292
-12.1%
jan 1, 2009
2.573
+0.452
21.33%
jan 1, 2010
1.536
-1.037
-40.29%
jan 1, 2011
1.566
+0.03
1.92%
jan 1, 2012
1.79
+0.224
14.32%
jan 1, 2013
1.806
+0.015
0.86%
jan 1, 2014
1.67
-0.136
-7.52%
jan 1, 2015
1.583
-0.087
-5.24%
Ranking of countries by current statistics by years


Comments: